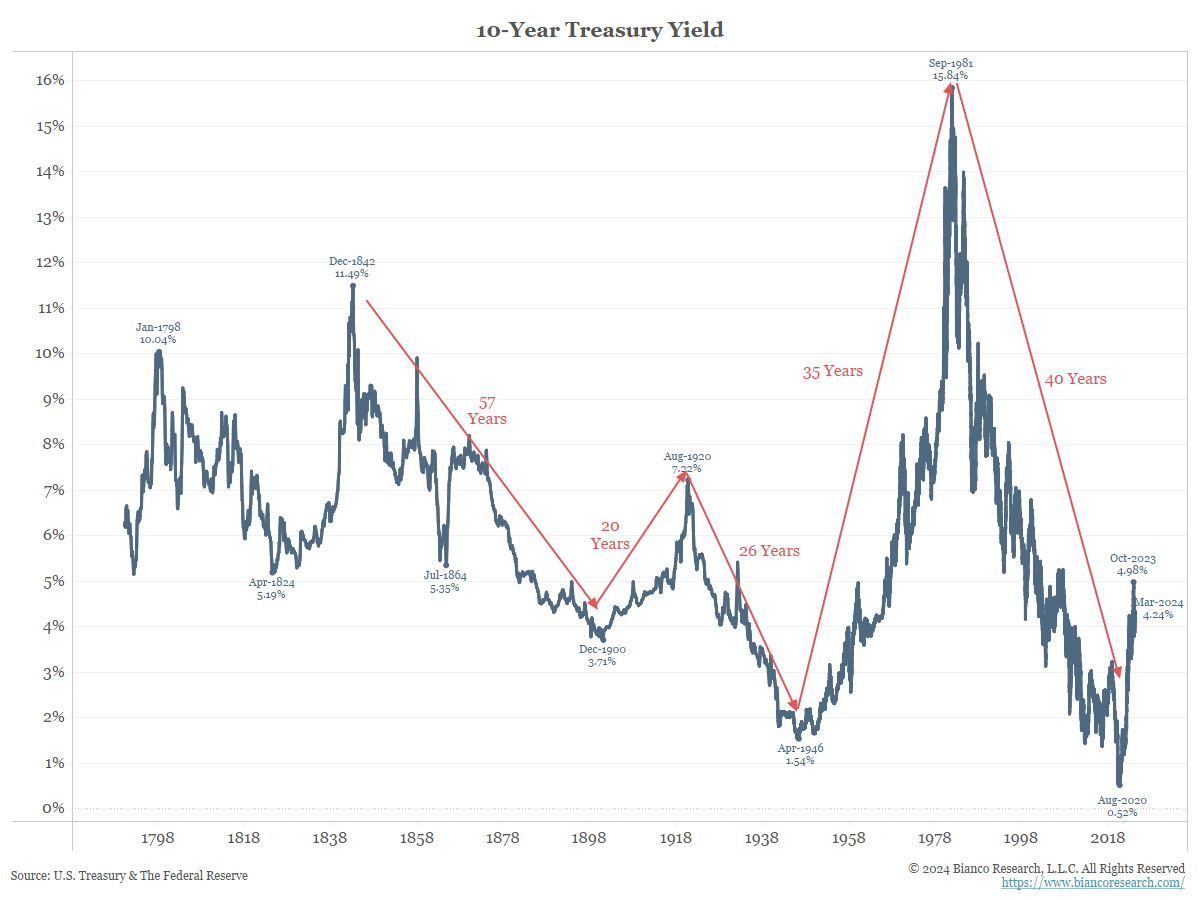
My long-time friend, Jim Grant, of the eponymous Grant’s Interest Rate Observer, recently quipped, “It is nice to have an interest rate to observe again.”
This simple line describes the epic shift in fixed-income management over the last several years. Bonds are no longer simply held for their capital gains. The yield once again matters.
As the chart to the left shows, the last few years broke the previous 40-year downtrend in rates and set up a potential secular low in 2020.
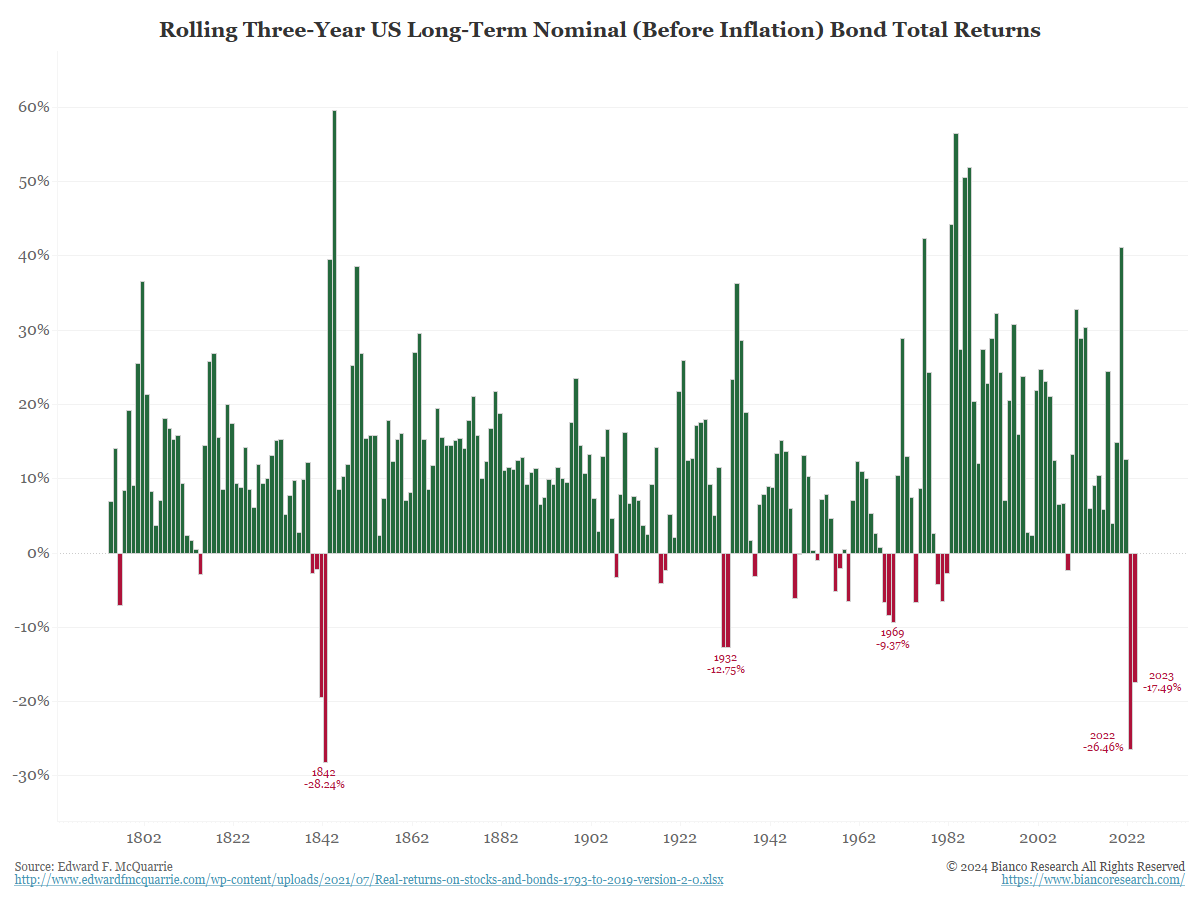
Since interest rates started to rise in 2020, it has been excruciating for bond investors. The chart to the right shows bond investors endured their biggest total return losses in 160 years!
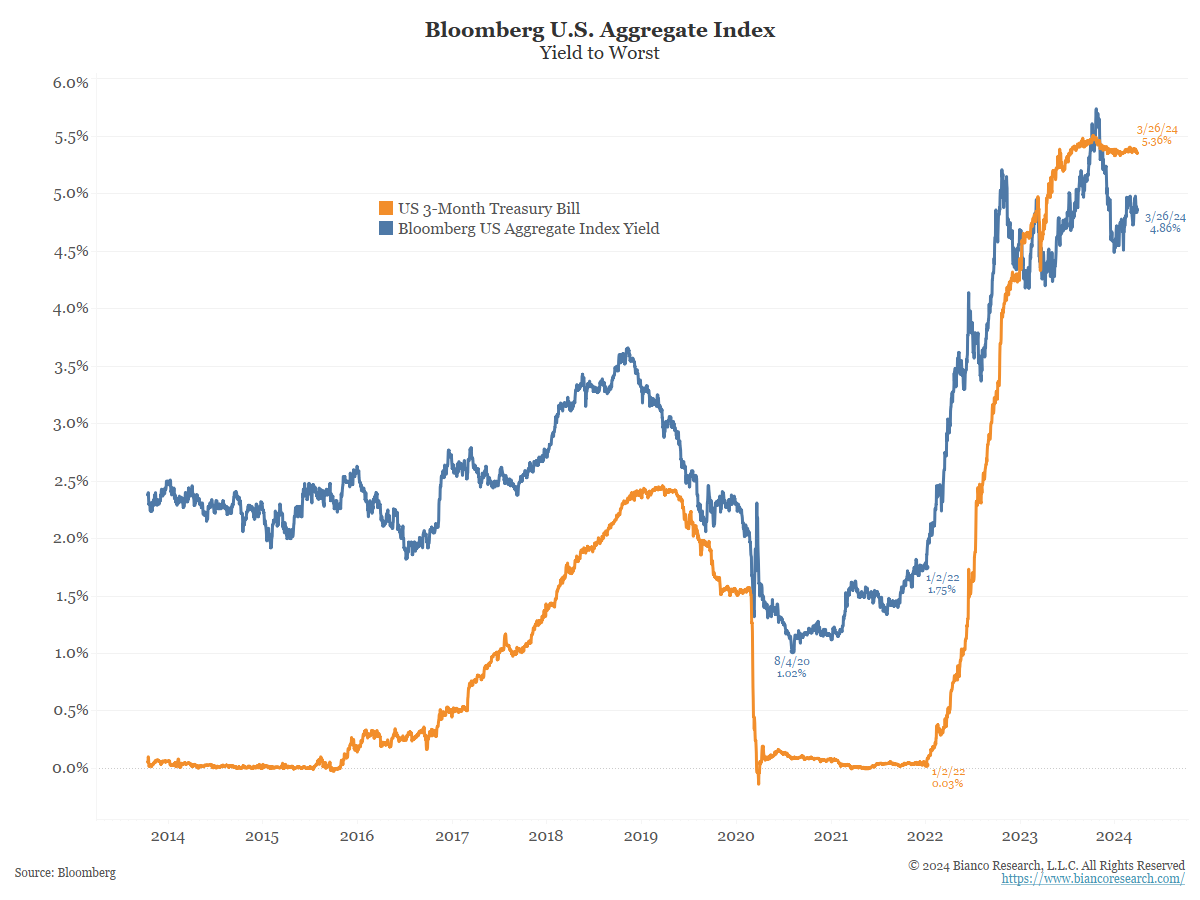
Now, with an “interest rate to observe again,” bonds present opportunity even if observable rates continue to trend higher.
Looking at three-month Treasury bills and the Bloomberg US Aggregate Index, yields of 5% are now fairly typical for most investors.
So what does this mean?
Dr. Jeremy Siegel and Jeremy Schwartz offer potential benchmarks in the latest edition of their must-read investment book, Stocks for the Long Run.
The table to the right shows the historical long-term returns for stocks (8.4%), bonds (5.0%), bills (4.0%) and gold (2.1%). Later in the book, they assert these long-term returns should not change much going forward.
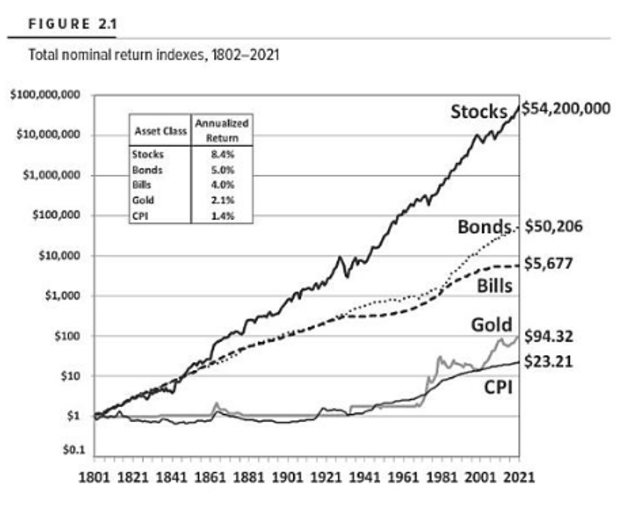
The brutal sell-off in bonds made yields competitive with stocks again for the first time in 15 years.
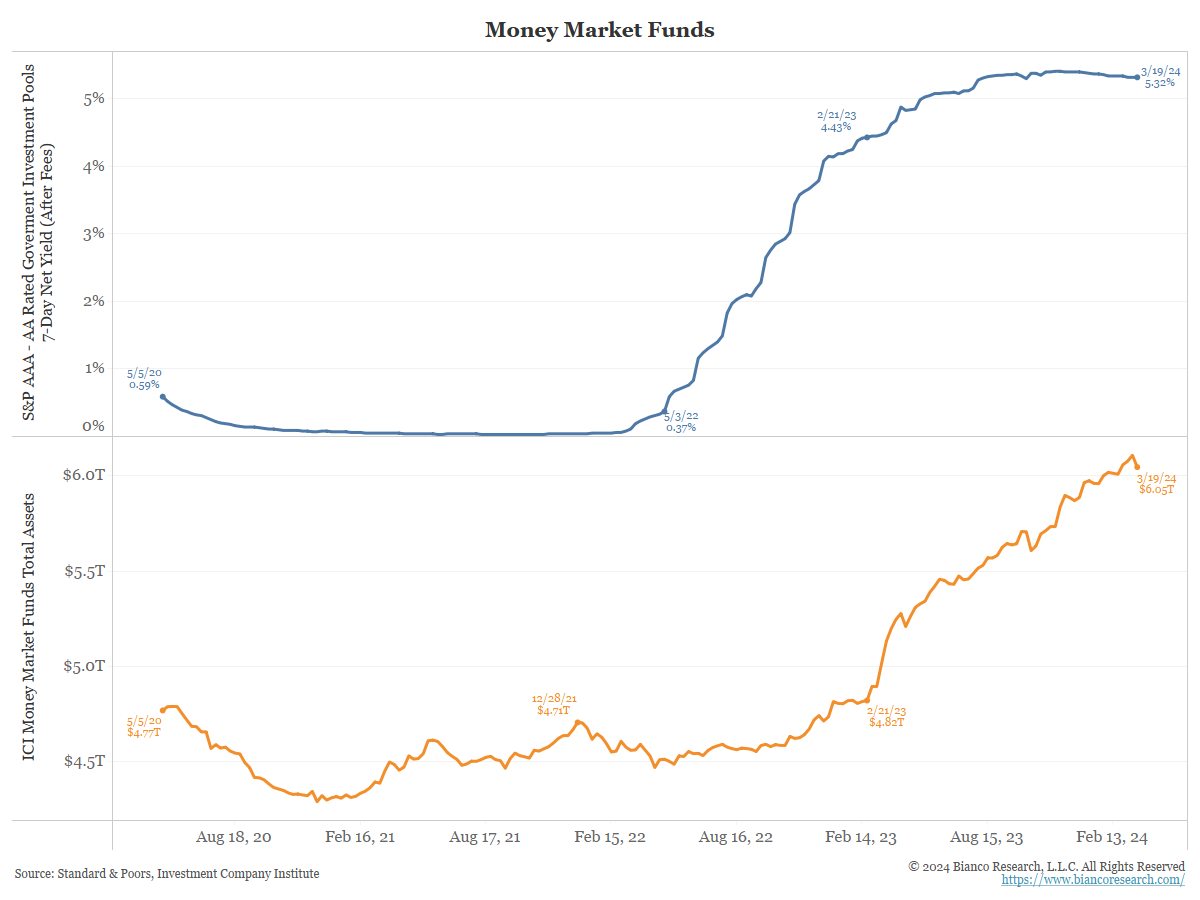
This is why we believe so many are pining for the Fed to cut rates. “Observable rates” are providing competition for risk assets. The top panel on the chart to the left shows the average money market fund yield is 5.32%, or two-thirds of what stocks are expected to offer (8%).
However, a money market fund has a constant $1 NAV. Two-thirds of the stock market’s expected return with no market risk is good enough for many. This is why money market assets have risen by $1.5 trillion in less than 18 months.
So why not take a money market yield and call it a day? This leaves too many opportunities on the table.
Outlook
We continue to believe the U.S. economy is doing better than most believe, aka the “no landing” scenario.
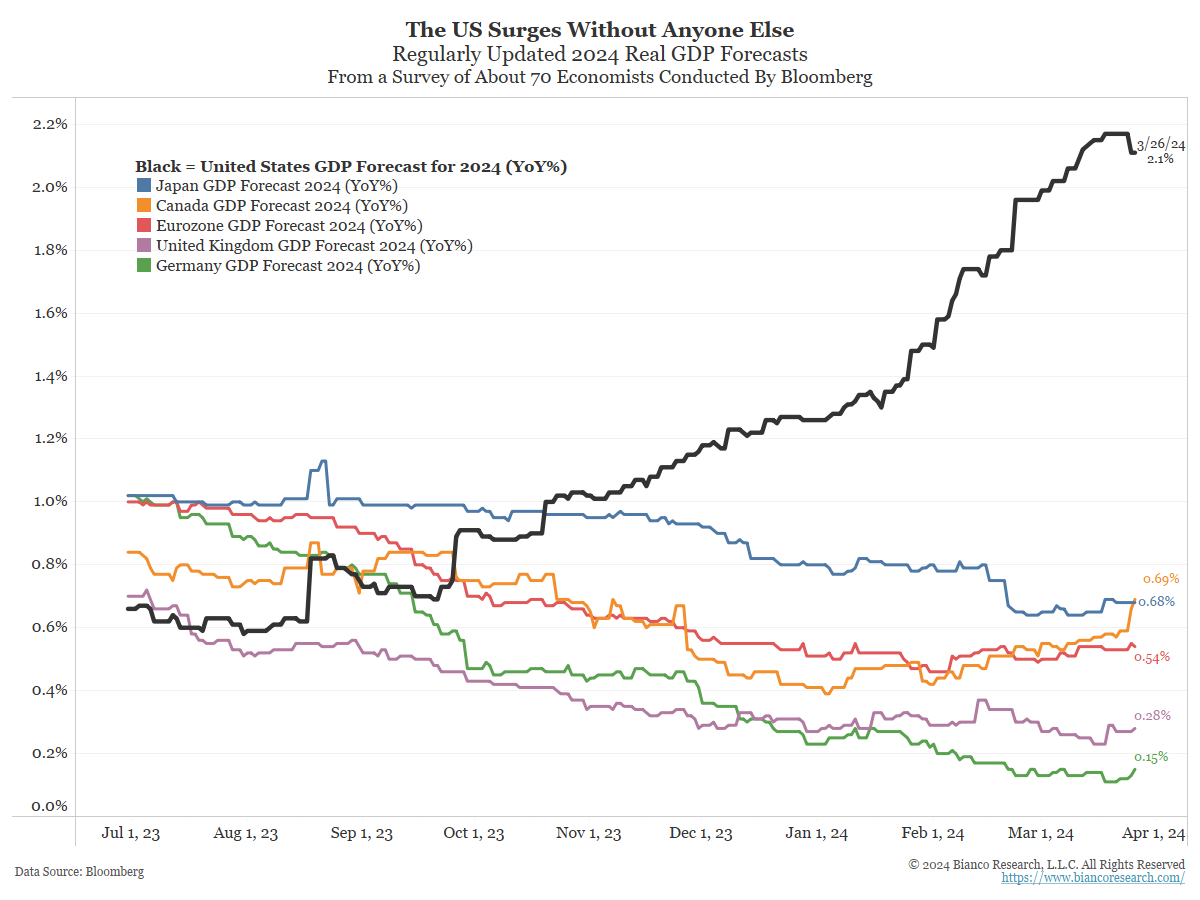
The chart to the right shows the 2024 real GDP forecasts from a survey of economists conducted regularly by Bloomberg. The black line shows U.S. GDP is forecasted to be much higher than the rest of the world.
As the Sesame Street song goes, “One of these things does not look like the others.”
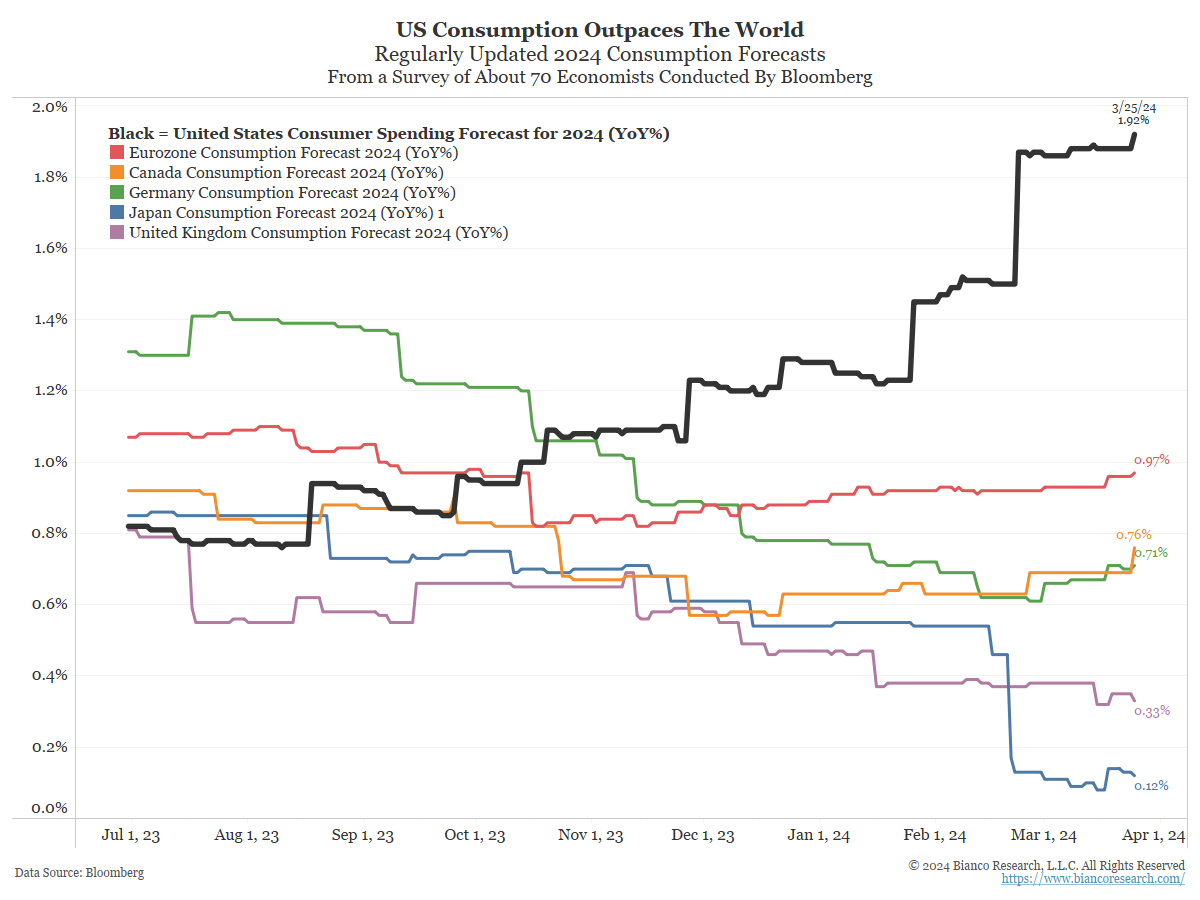
Driving the divergent forecasts above is an equally divergent forecast for personal consumption.
“One of these things does not look like the others” also applies here.
Strong consumption leading to strong growth is also going to keep inflation sticky. Economists are starting to forecast exactly this.
Beating A Benchmark
It is widely known that active stock managers struggle to beat their benchmark.
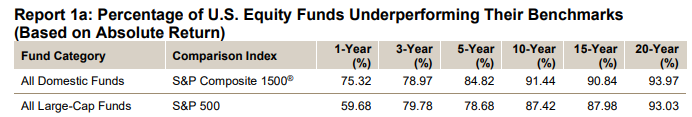
The table below comes from the S&P Index Versus Active (SPIVA) report through year-end 2023. Most active equity managers, approaching 80% to 90% over longer time frames, underperform their benchmark.
Why? The simple answer is the “all-stars” make up the largest weighting in a stock index. These stocks usually appear overvalued by many accepted measures. But if a manager does not hold at least a full weighting in these stocks, they cannot keep up with the index.
Contrast this with fixed income. Since rates bottomed in 2020, the vast majority of managers have outperformed their benchmark.
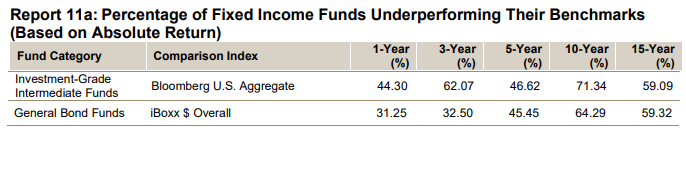
Two reasons account for active bond managers being able to compete with their benchmark.
- Fixed-income managers have many more options in a bear market with an inverted yield curve. Holding cash yields more than most options. This is helpful when prices are falling. They get paid to avoid risk.
- Second, unlike the equity market, the “problem-children” make up the biggest weighting in a fixed-income index. These are overleveraged companies with bad structures, countries that borrow too much, or inverted yield curves. These appear as problems on screens for fair value, and avoiding them leads to outperformance.
Index Performance
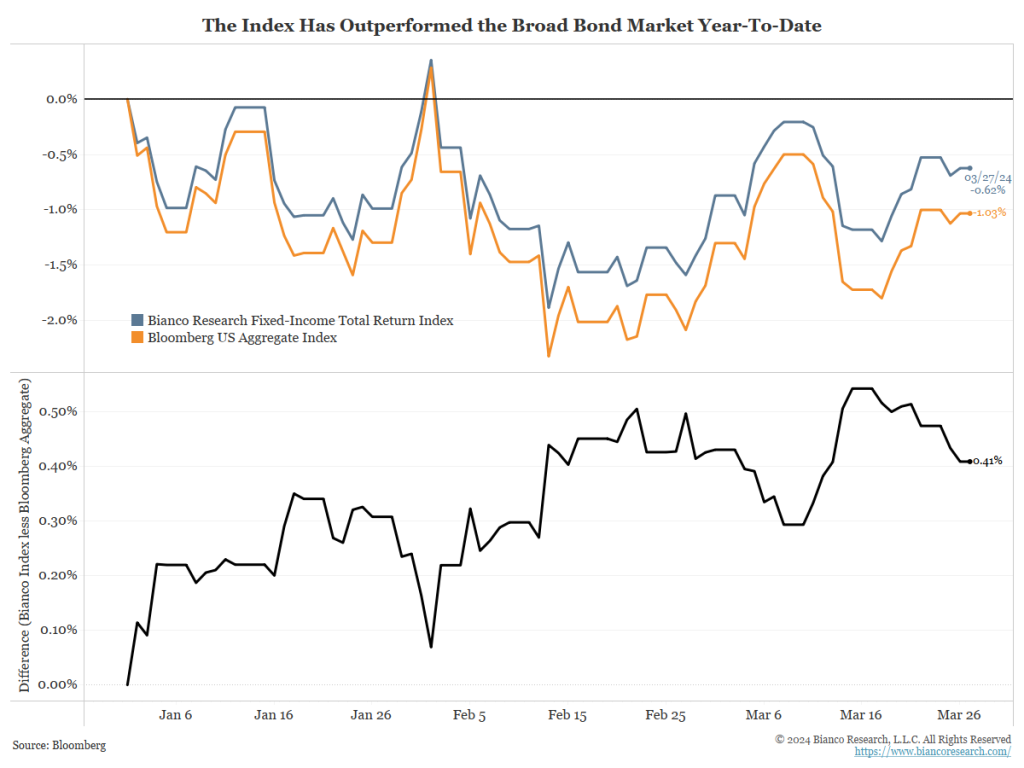
The Bianco Research Fixed-Income Index has outperformed a broad-based benchmark by 41 basis points year-to-date.
For the time being, this outperformance has come by losing less than the benchmark. We believe observable rates will continue to push these total returns higher, and our goal is to continue separating our performance from the overall market.
Relative Positioning
Duration
90%
Short duration
Yield Curve
Neutral
Corporate Credit
Underweight
Securitized
Underweight MBS
Conviction
10% 0-5 US TIPS
& 10% USD Bullish
Our strategy is based on qualitative and quantitative inputs including economic data and interpretations of government policy. Position guardrails include 50% – 200% allocation relative to the benchmark for credit, duration, and structure/mortgage weight. A high-conviction exposure to more speculative or diversifying positions is constrained to 0% – 20%.
The characteristics below reflect how we would best position a portfolio of fixed-income ETFs to achieve maximum total return over a comparable baseline neutral portfolio of fixed-income securities (benchmark).
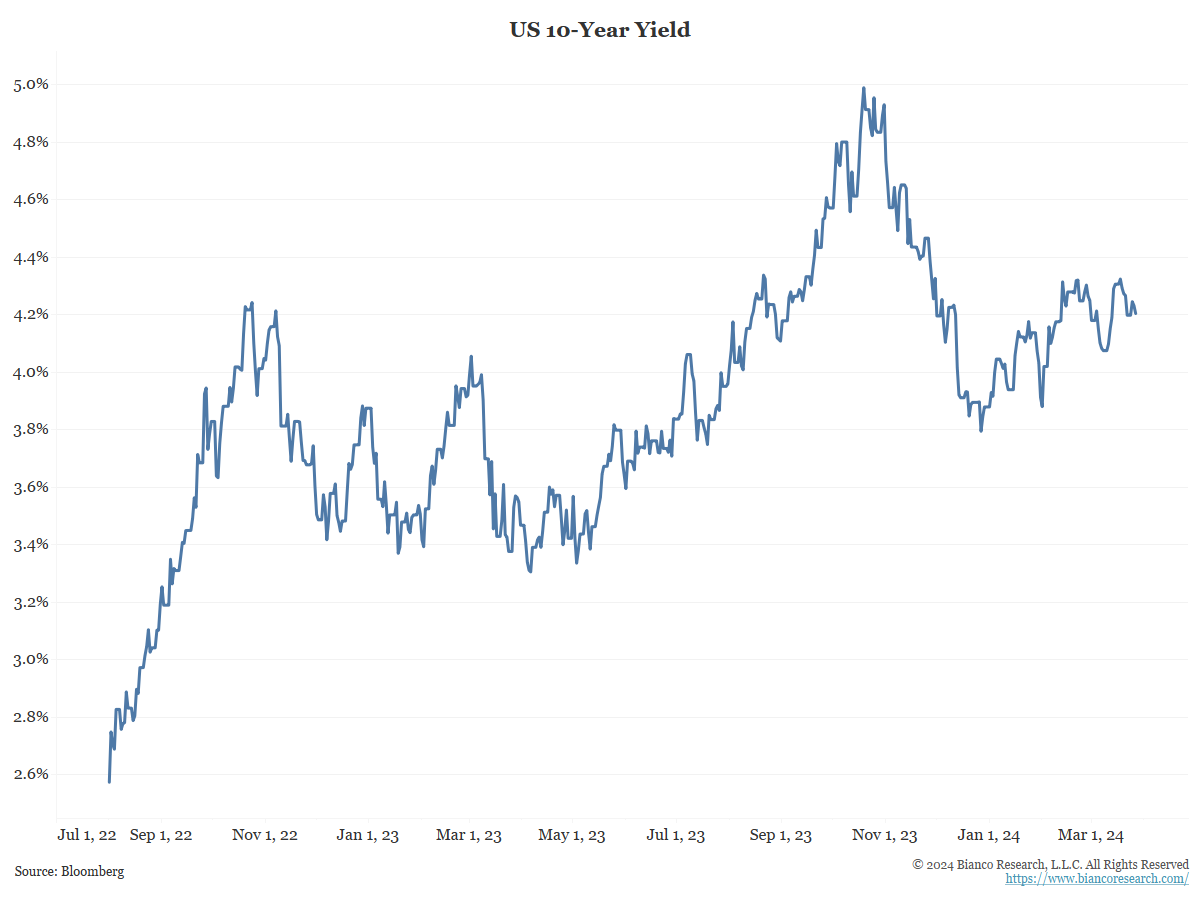
90% Duration
Our index is underweight duration, based on the belief rates could head higher. 10-year yields were recently at a 16-year high.
Neutral Curve Position
Our index holds no curve position relative to the benchmark.
90% Underweight Credit
In January, we moved to underweight in corporate bonds relative to our index (90%). This was due to record corporate bond issuance and the overbought stock market.
This position has not worked as hoped, but its drag has been minimal since the end of January. We still expect it to show positive results in the future and will maintain this position.
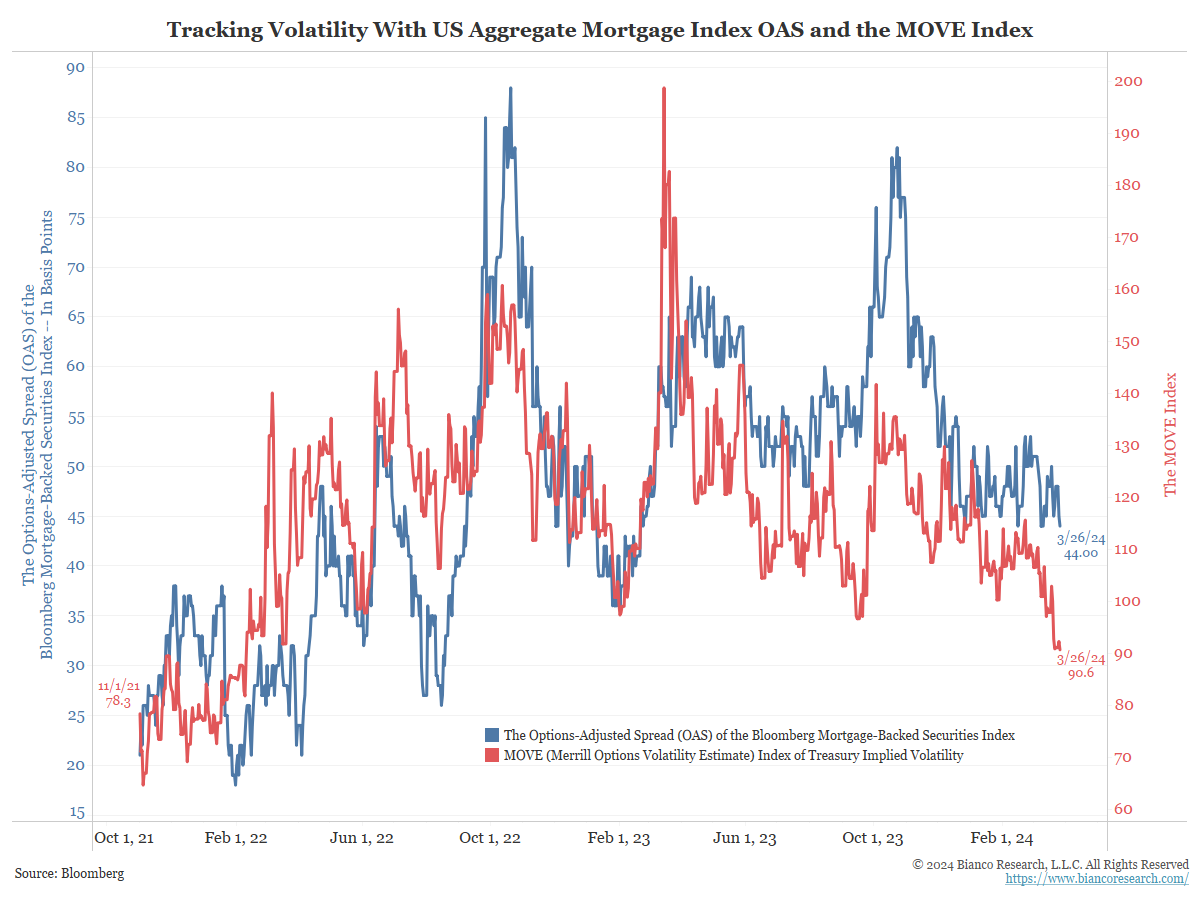
80% Underweight Securitized
We remain underweight (80% of our benchmark) in mortgage-backed securities.
The chart to the left shows mortgage performance (in blue, as the option-adjusted spread) and bond market volatility (in red, the MOVE Index). Volatility is down (red line) because the Federal Reserve is expected to cut rates three times this year. So, the bond market uncertainty index is down.
However, as we discussed above, if the economy stays strong and inflation surprises, we expect uncertainty to return to the bond market, making three rate cuts difficult.
10% TIPS Allocation & 10% USD Bullish Allocation
The index owns short-maturity inflation securities (TIPS). Previously, we held a 20% conviction exposure to 0-5 US TIPS. We have reduced this position to 10% of our index.
We continue to anticipate inflation break-evens holding these levels as inflation remains sticky. This would continue to provide attractive inflation protection with little risk of price declines.
This month, we added a 10% long U.S. dollar exposure. This bet would benefit if the U.S. economy outperforms the rest of the world, leading to higher yields and a strong dollar.
Allocation Changes
| Name | April 2024 | March 2024 |
|---|---|---|
| iShares MBS ETF | 22.75 | 23.30 |
| iShares 0-5 Year TIPS Bond ETF | 10.00 | 20.00 |
| WisdomTree BBG USD Bullish Fund | 10.00 | 0.00 |
| Vanguard Long-Term Corporate Bond ETF | 8.10 | 8.14 |
| Schwab Long-Term U.S. Treasury ETF | 7.75 | 7.00 |
| Vanguard Intermediate-Term Corporate Bond ETF | 7.00 | 6.41 |
| Vanguard Short-Term Corporate Bond ETF | 6.69 | 7.24 |
| iShares 7-10 Year Treasury Bond ETF | 6.25 | 5.5 |
| WisdomTree Floating Rate Treasury ETF | 5.75 | 8.00 |
| Schwab Short-Term U.S. Treasury ETF | 5.5 | 5.91 |
| iShares 3-7 Year Treasury Bond ETF | 5.21 | 3.50 |
| iShares BBB Rated Corporate Bond ETF | 5.00 | 5.00 |