The Index strategy is based on qualitative and quantitative inputs, including economic data and interpretations of government policy. Asset allocation guardrails include 50% – 200% allocation relative to the benchmark for credit, duration, and structure/mortgage weight. A high-conviction exposure to more speculative or diversifying positions is constrained to 0% – 20%.
The characteristics below reflect how we would best position a portfolio of fixed-income ETFs to achieve maximum total return over a comparable baseline neutral portfolio of fixed-income securities (benchmark).
Relative Positioning
Duration
90% Relative Underweight
Yield Curve
Bulleted
Corporate Credit
Underweight
Securitized
Overweight
Conviction
5% EM Local Debt & 5% Short-Term TIPS
Rationale
90% Duration
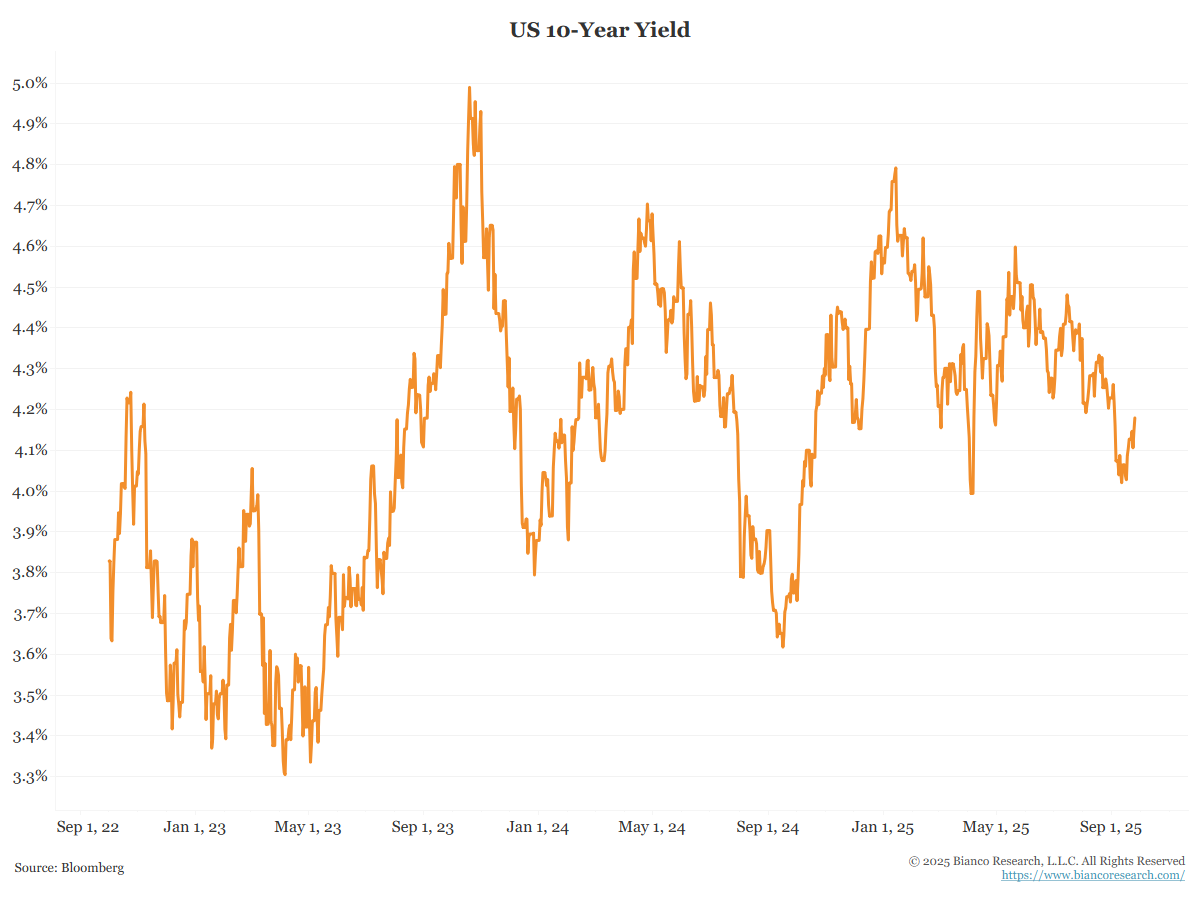
The Index holds a 90% relative duration position compared to its benchmark, positioning for a rise in interest rates.
The committee expects the economy and inflation to remain stronger than expected. Recent talk of recession, tariffs, and 10% stock market corrections should have produced lower rates. Yet, the 10-year yield remains well above its low of 3.60% last September.
Bulleted Curve Structure
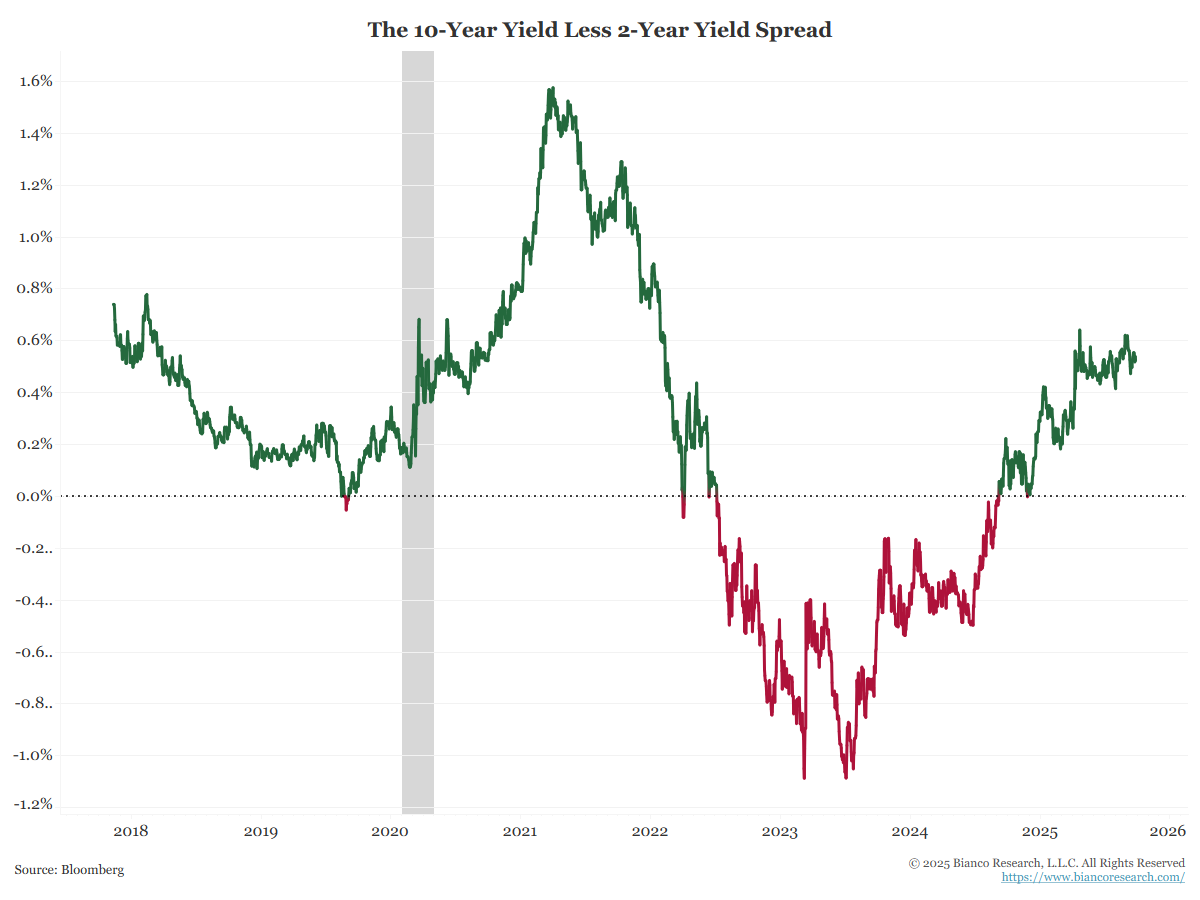
The Index returned to a bulleted curve position relative to the benchmark. This means it is overweight in the middle of the yield curve. This position will benefit from the yield curve steepening.
We expect long-term yields to rise faster than short-term yields and steepen the yield curve.
70% Underweight Credit
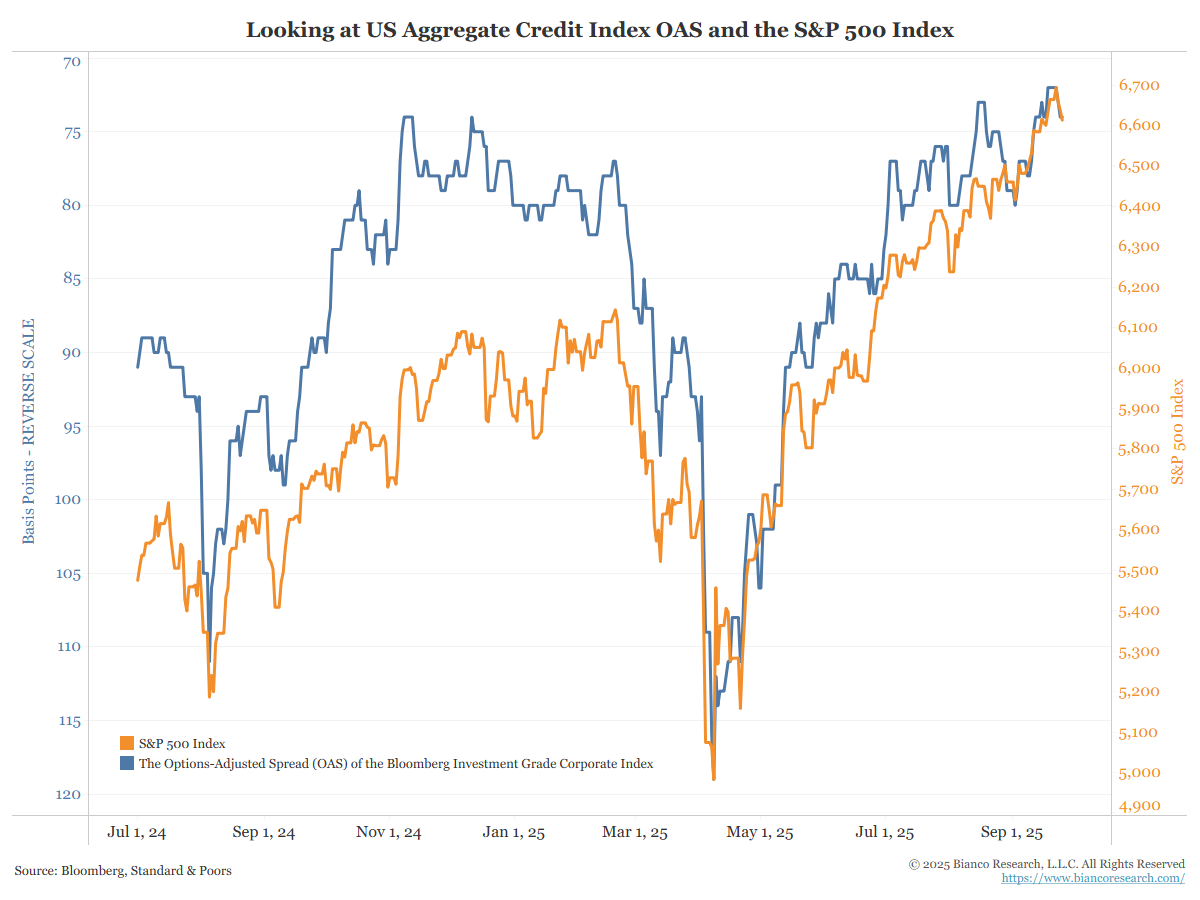
The Index is 70% weighted in corporate bonds relative to the benchmark, given strong corporate bond issuance (an increase in supply) and high valuations in the equity market.
Relative corporate bond positions are correlated to stock market movements.
120% Overweight MBS
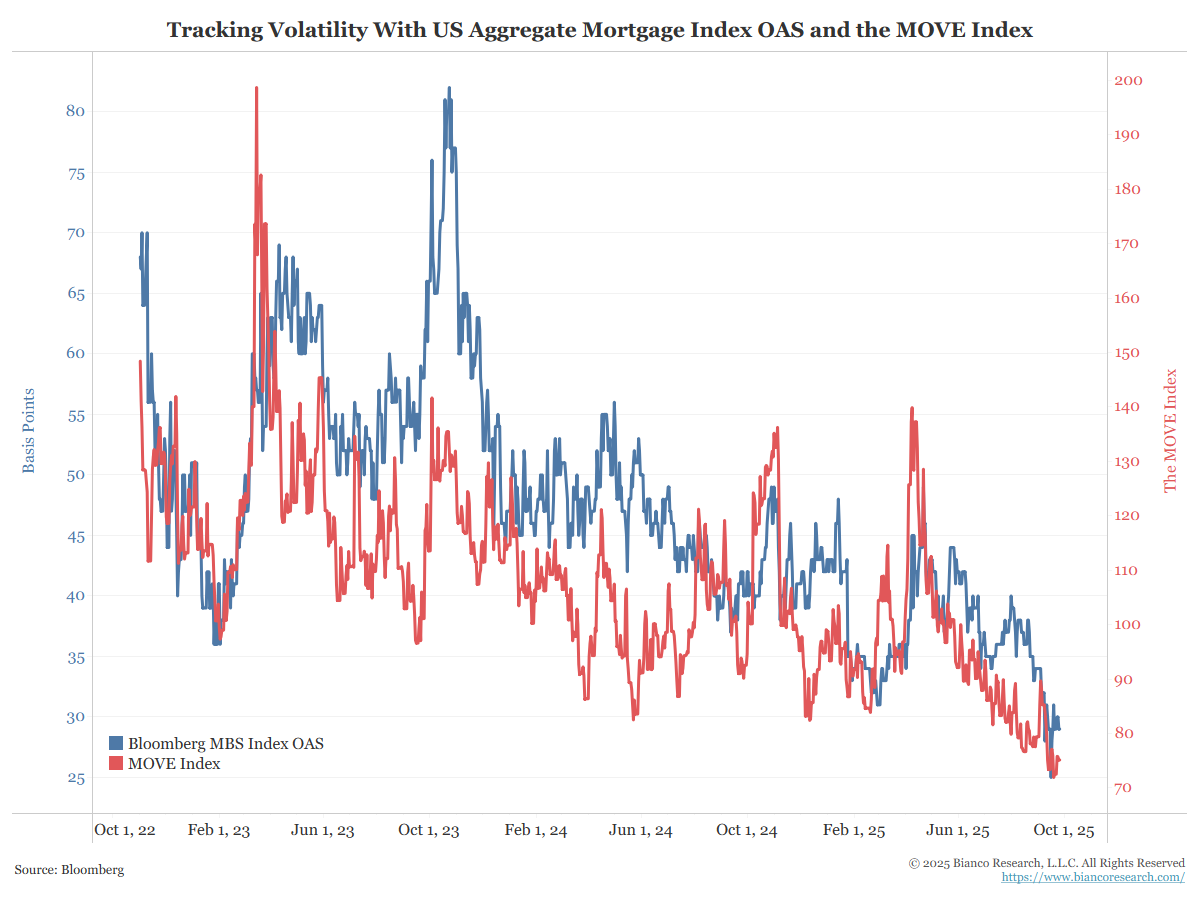
The index holds a 120% overweight position in MBS.
MBS yields are significantly higher than Treasury yields and comparable to those of investment-grade corporate bonds.
Rising Treasury yields will benefit MBS by slowing the rate of refinancing, keeping MBS yields high, and limiting any price declines.
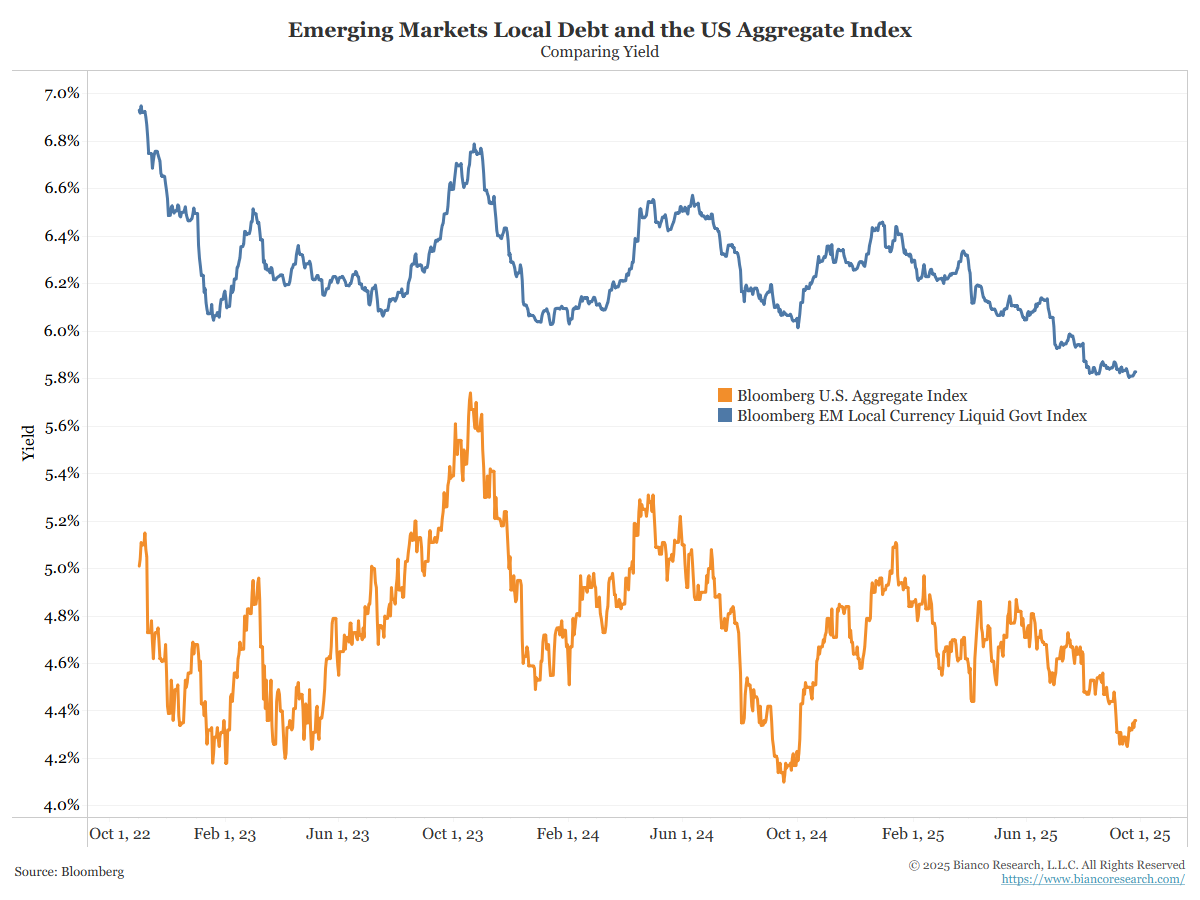
5% EM Local Debt & 5% Short-Term TIPS
The index holds a 5% allocation to EM local debt and a 5% allocation to 0-5 year short-term TIPS.
The EM Local Debt position offers a higher yield than domestic corporate bonds and has benefited from a weakening dollar relative to these currencies. The reduction in position was deemed appropriate.
The short-term TIPS position will offer inflation protection at an attractive yield.
Allocation Changes
| Name | October 2025 | September 2025 |
|---|---|---|
| iShares MBS ETF | 32.05 | 32.05 |
| iShares 3-7 Year Treasury Bond ETF | 17.00 | 11.40 |
| iShares 7-10 Year Treasury Bond ETF | 12.50 | 1.10 |
| Vanguard Short-Term Corporate Bond ETF | 8.30 | 8.20 |
| Schwab Short-Term U.S. Treasury ETF | 6.50 | 18.80 |
| WisdomTree Emerging Markets Local Debt Fund | 5.00 | 5.00 |
| iShares 0-5 Year TIPS Bond ETF | 5.00 | 5.00 |
| iShares BBB Rated Corporate Bond ETF | 4.50 | 4.50 |
| Vanguard Intermediate-Term Corporate Bond ETF | 4.15 | 3.40 |
| Vanguard Long-Term Corporate Bond ETF | 3.00 | 3.65 |
| Schwab Long-Term U.S. Treasury ETF | 2.00 | 6.95 |