Commentary
Late last year, we viewed the dollar’s strength after the September low as a sign of a rebound that would last into the spring/summer. Driving this belief was the outlook for a very strong US economy and sticky inflation well above the Fed 3% target.
This view is largely intact as the Atlanta Fed GDPnow Q4 real GDP forecast is projecting a strong 5.4% GDP, and Wall Street’s December Core PCE inflation forecast is expected to tick up from November’s 2.8% to 3.0%.
In our opinion, what changed is that the rest of the world is committed to expansionary policies. Whether the catalyst was the Trump Administration’s capture of Venezuelan President Maduro and/or the ongoing strife around Greenland, the ‘Sell America’ trade has again gained traction, and the U.S dollar is again falling.
This is pushing benchmark yields around the world, as we detailed in our investor letter last month. They again rose in January, benefiting a shorter-duration portfolio and countering some of the dollar decline in the Index.
Since there is no clear end to the “Sell America” pressure, we anticipate a further decline in the dollar, with local-currency emerging-market debt looking more attractive.
While corporate spreads are at multi-year lows, and small-cap equity valuations are near expensive levels, we believe the strong nominal growth outlook (high Q4 GDP growth and sticky inflation noted above) should keep spreads tight and valuations high. We expect high-yield debt to stay attractive, allowing us to pick up extra yield high-yield names such as industrial, consumer staples, and energy.
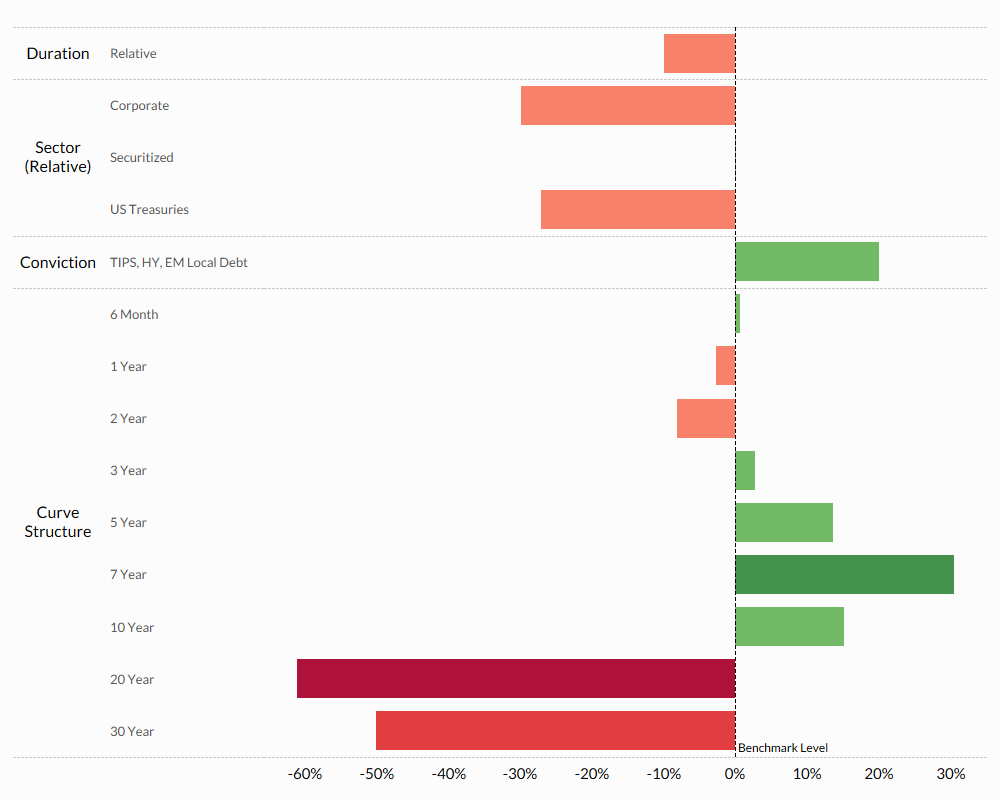
The characteristics, rationale, and deviations below reflect the index positioning relative to the baseline benchmark effective February 2, 2026.
Relative Positioning
Duration
Underweight
Yield Curve
Bulleted
Corporate Credit
Underweight
Securitized
Neutral
Conviction
Short-Term TIPS & EM Local Debt & High Yield
Rationale
| 90% Duration | The committee expects the economy and inflation to remain stronger than expected. This should continue to reduce the outlook for 2026 Fed rate cuts. The duration of our index is 90% the duration of a benchmark index. |
| Bulleted Curve | Relative corporate bond positions are correlated to stock market movements. Equities are near all-time highs, and IG spreads are near all-time tight levels. Investment-grade corporates look less attractive compared to higher-yielding ones. |
| 70% Underweight IG Credit | The Index has held an underweight position relative to the benchmark in investment-grade corporate bonds, believing their tight credit spreads and high valuations offer little value. Given our belief in a strong economy and sticky inflation, we believe we should increase our corporate exposure but through high-yield exposure. |
| Neutral Securitized | The index holds a neutral position relative to the benchmark within the securitized sector. In our view, the sector is appropriately valued, and our positioning reflects that. |
| 10% Short-Term TIPS | A short-term TIPS position offers inflation protection at an attractive yield. Breakeven inflation rates have narrowed, making this an attractive position. |
| 5% Interest Rate Hedged High-Yield | With credit spreads extremely tight and small caps rallying relative to large caps, picking up yield from lower-quality corporates is an attractive play. The Index entered into a new high-yield position, interest rate hedged, which offers protection from rising interest rates. |
| 5% Emerging Market Local Debt | The ‘Sell America’ trade crushed the dollar in January. The index has exited a bullish dollar position in favor of a smaller local-currency emerging-market debt position. This positioning is underweight China (and overweight Latin America) as China still has considerable political risk, and the risk in Latin America is now known and discounted in markets following the arrest of Maduro. |
Deviations
Allocation
| Name | Market Value (%) |
|---|---|
| iShares MBS ETF | 26.35 |
| iShares 3-7 Year Treasury Bond ETF | 16.62 |
| iShares 7-10 Year Treasury Bond ETF | 10.58 |
| iShares 0-5 Year TIPS Bond ETF | 10.00 |
| Vanguard Intermediate-Term Corporate Bond ETF | 7.56 |
| WisdomTree Emerging Markets Local Debt Fund | 5.00 |
| WisdomTree Interest Rate Hedged High Yield Bond Fund | 5.00 |
| Vanguard Short-Term Corporate Bond ETF | 4.80 |
| Vanguard Long-Term Corporate Bond ETF | 3.49 |
| Schwab Short-Term US Treasury ETF | 3.01 |
| Schwab Long-Term U.S. Treasury ETF | 2.34 |
| iShares Agency Bond ETF | 2.25 |
| iShares BBB Rated Corporate Bond ETF | 2.00 |
| iShares 20+ Year Treasury Bond ETF | 1.00 |