
Bloomberg
Bond Veteran Jim Bianco Turns Bullish for First Time Since 2020
Jim Bianco, a Wall Street veteran and longtime market watcher, is turning bullish on US Treasuries for the first time in six years after benchmark yields surged to two-decade highs, creating an enticing entry point. “This is a value play,” said Bianco, president and founder of Chicago-based Bianco Research. “If we start to see yields going higher, I’m going to continue to get in.”
For the last three years, we have been cautious to outright bearish on bonds. This was grounded in the belief that bond yields did not reflect the U.S. economy’s current state. In other words, they were too expensive.
Over the past two weeks, yields on the 5-year note through the 30-year bond all moved above 5% for the first time since mid-2007, just before the Fed began responding to the financial crisis.
Once the bond market reached this 5% milestone, we argued bonds were no longer expensive and now reflect the current state of the economy.
Therefore, for the first time in six years, we moved our duration to 105% of our benchmark index.
What Determines the Proper Bond Yield?
In the old days, meaning you go back 25 years ago, if we announced good numbers, interest rates went down. Now, if you announce good numbers, interest rates go up because they’re so afraid of inflation. But what they’re doing is they’re really saying you can never really step on the gas. We could have a GDP of 14, 15, 16, and 20. But every time you do well, we just announced great numbers, and so now they’re talking about raising interest rates. It’s ridiculous, because success and growth does not cause inflation. Inflation’s caused for other reasons.
— President Trump, August 31, 2026
Above, Trump argues a strong economy should produce a lower yield, and that the only reason it does not is a misplaced fear of inflation. This view holds that real economic growth is not an input to bond yields.
This mixes up two questions. Whether growth causes inflation is one. Whether growth belongs in the fair value of a yield is the other.
Nominal GDP
First, we agree with the last part of Trump’s statement: success and growth do not cause inflation. Inflation’s caused for other reasons. We’ll leave why for another day.
But we disagree with the implication that growth plays no role in determining interest rates. Real economic growth is a critical component of determining interest rates.
A nominal interest rate is the cost of money in a nominal economy. Nominal GDP includes both real growth and inflation.
This long-term chart below shows a consistent relationship between nominal GDP growth and interest yields. So, growth matters to the proper level of interest rates.
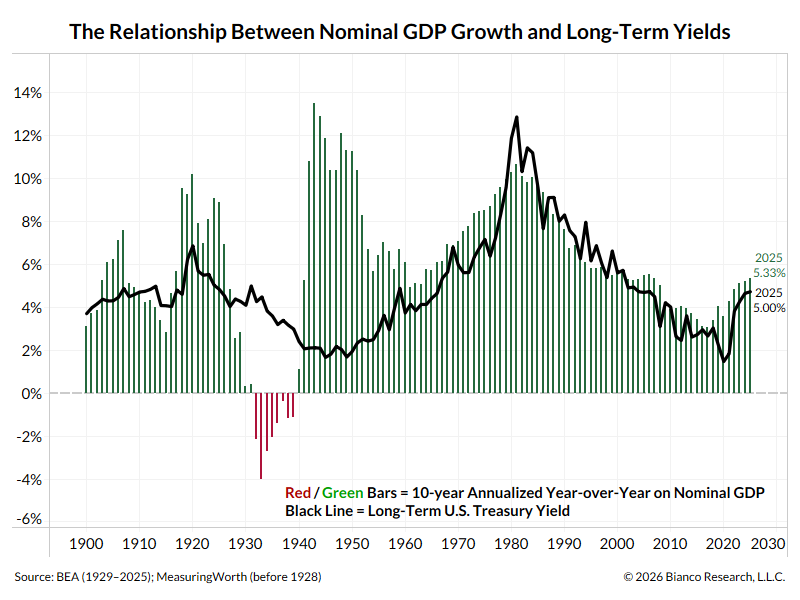
The bars and the line rise and fall together for most of the 125 years shown. There are two notable exceptions. In the 1930s (The Great Depression), nominal GDP went significantly negative, but nominal yields could not follow it far below 0% (just below 0% is about the limit, as Europe and Japan learned in the last decade). In the 1940s, nominal GDP surged during World War II, but the Fed capped long-term Treasury yields at 2.5% to help finance the war. That peg lasted until the 1951 Treasury-Fed Accord.
The shorter-term chart below makes the same comparison.
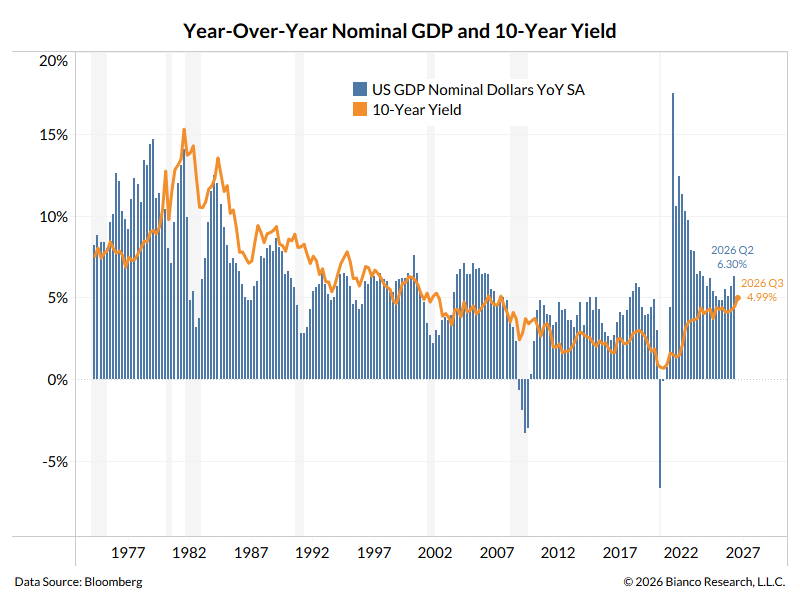
Year-over-year nominal GDP and the 10-year yield moved together, measured quarterly, for most of the last 50 years. The divergence came in 2020–21, when nominal growth collapsed and then sharply rebounded during the COVID shutdown. Yields looked through these wild gyrations.
Real Growth
The nominal GDP measures above are backward-looking measures. Bond yields, by contrast, are forward-looking measures. They anticipate what’s coming next.
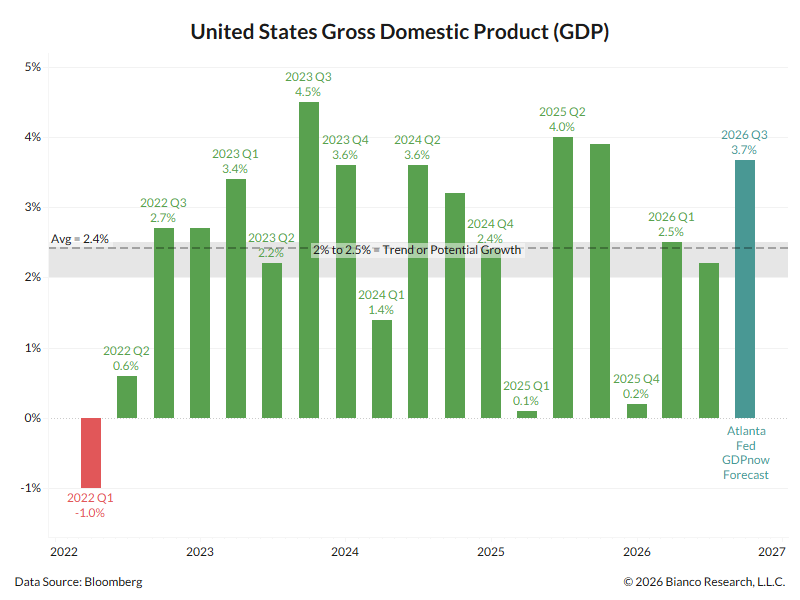
The next chart shows real GDP going back to Q1 2022, when the Fed started raising rates off 0%.
Economists believe the U.S. economy’s trend, or potential growth, is somewhere between 2.0% and 2.5% (shaded). Since Q1 2022, it has been averaging near the upper end of this range at 2.4% (dashed line).
Strong growth is expected to continue in Q3 2026. As the cyan bar shows, the Atlanta Fed GDPNow is projecting 3.7% annualized growth for Q3 2026.
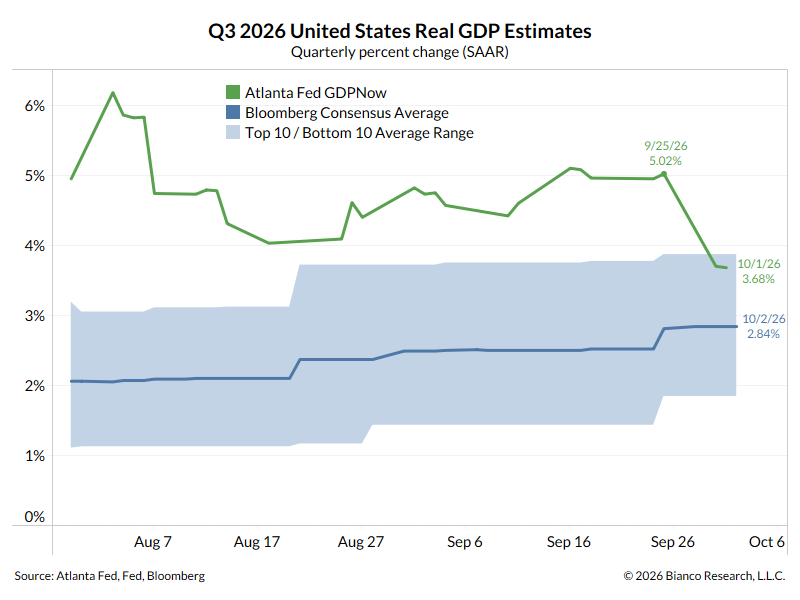
Economists are not as optimistic. The Bloomberg consensus for Q3 2026 is 2.84%, well below GDPNow’s 3.68%. GDPNow has come down from 5.02% on September 25, but it still sits at the top of the economists’ range (shaded).
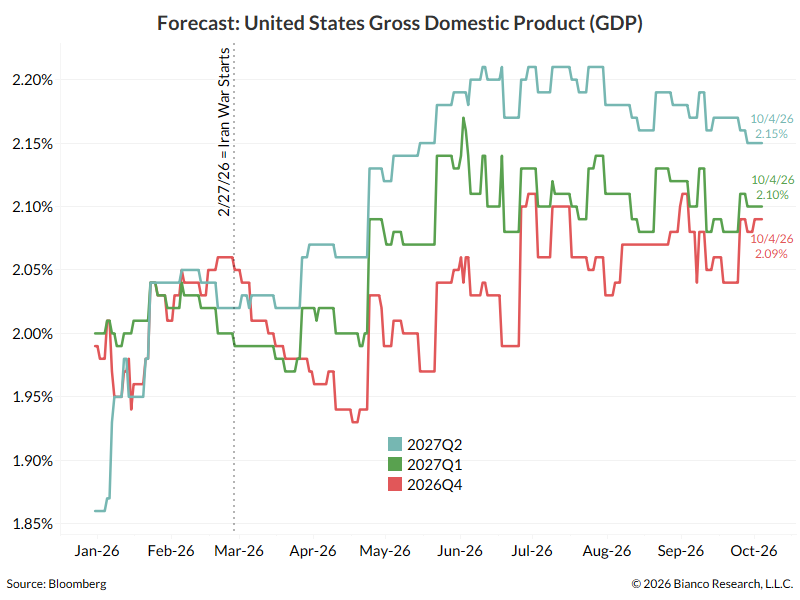
Bloomberg regularly surveys about 70 economists, and one question asks for their real GDP forecast. The next three quarters are shown below.
They expect at least 2% growth over the next 3 quarters, or into mid-next year. Note that over the last couple of quarters, they’ve been underestimating actual growth.
Overall, GDP is expected to stay within the range of potential growth, a little above 2%, for the next several quarters.
Inflation
In 2000, the Federal Reserve adopted the Personal Consumption Expenditures (PCE) price index as its preferred inflation measure. Inflation’s hard to read given the volatility in food and energy prices, so we exclude those components and use the core PCE metric.
As Milton Friedman put it, inflation is “always and everywhere a monetary phenomenon.” Money is ephemeral and hard to measure. It is more than just the M2 money supply. Does it include unrealized gains in housing and investments? If so, what percentage of those gains should be considered “money?”
Inflation remains one of the hardest things for economists to project. Former Federal Reserve Governor Dan Tarullo addressed these issues in a 2017 speech (“Monetary policy without a working theory of inflation“).
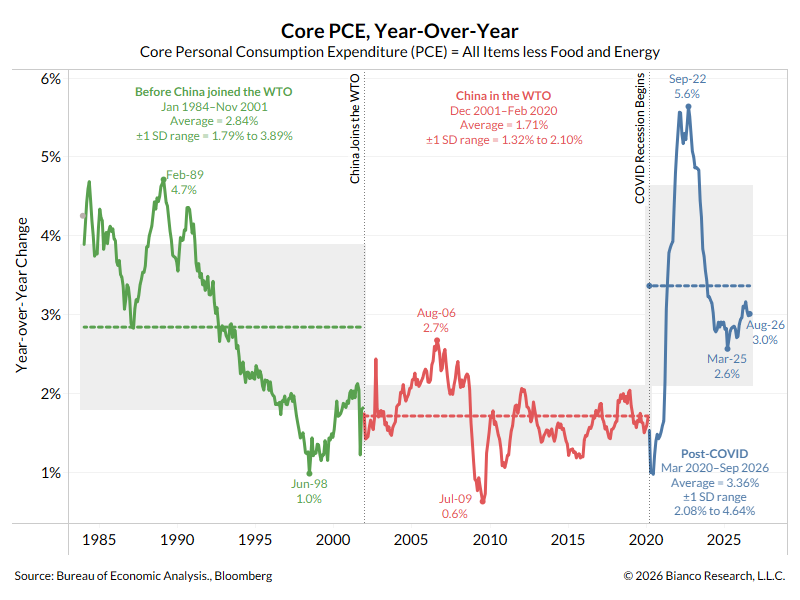
Inflation also fluctuates with economic cycles. That’s why we show core PCE color-coded below, highlighting what we believe are the more important cycles that impact inflation.
The biggest impact on inflation is in red: China joining the World Trade Organization (WTO) in December 2001. From this date to COVID in 2020, inflation was well-behaved and averaged (red dashed line) below the Fed’s 2% target (adopted in 2012).
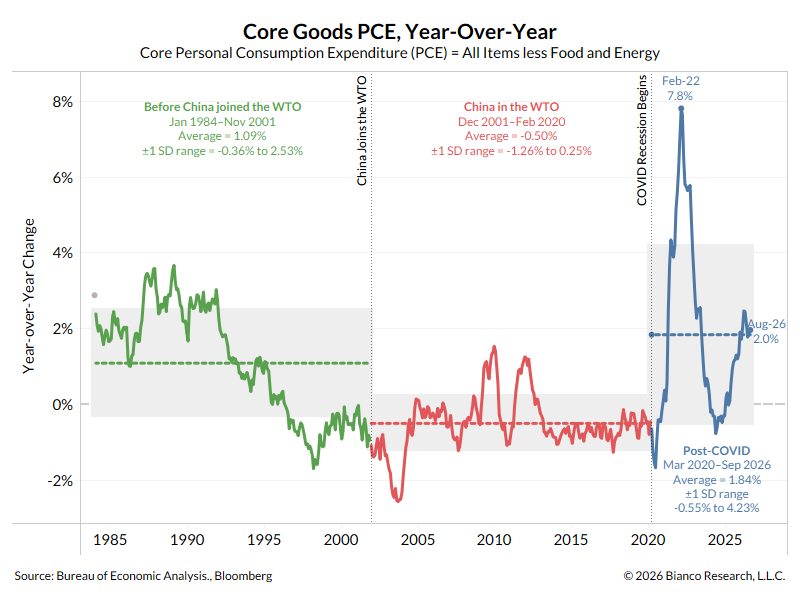
The primary driver of this low-inflation era was China consistently exporting cheaper goods to the U.S., causing goods deflation, as shown next. During the WTO period (red below), U.S. core goods inflation averaged -0.5% (red dashed line).
We like MIT economist Rudiger Dornbusch’s famous observation that economic expansions do not die of old age; they’re murdered.
As the blue in the two charts above shows, the post-COVID era “murdered” low inflation.
Post-COVID is the era of deglobalization, tariffs, chronic supply chain problems, and two wars (Ukraine and Iran).
Core goods PCE prices rose from a WTO average of -0.5% (red) to a post-COVID average of +1.84% (blue). Over the same periods, core PCE inflation nearly doubled, from 1.71% during the WTO period (red) to 3.36% in the post-COVID period (blue).
The problem with inflation is not that it’s going up. The problem is that, without constant goods deflation, it cannot disinflate back to the Fed’s 2% target. In this post-COVID era, constant goods deflation is no longer possible without a full-blown recession that saps demand.
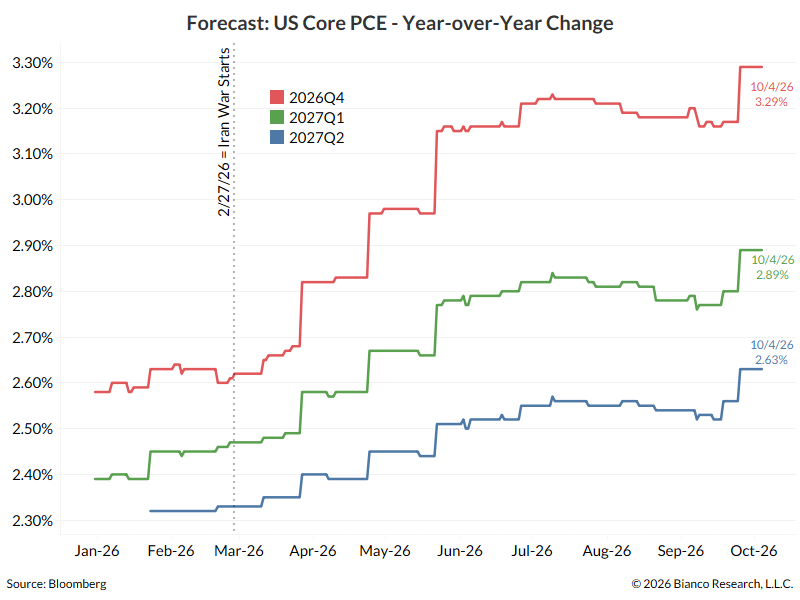
The chart below shows Bloomberg’s forecast from its survey of about 70 economists. They expect core PCE to stay above the Fed’s 2% target through mid-next year.
These forecasts have risen sharply since the Iran war began in late February. The Q4 2026 estimate has climbed from 2.58% in January to 3.29% today.
5% World
Above, we show that real GDP growth has averaged 2.4% since 2022, and economists expect a little over 2% for the next three quarters. Core PCE inflation has averaged 3.36% over the last six years, and economists expect 2.6% to 3.3% through mid-next year. Add the two together and nominal GDP looks like it will continue to average 5% to 6%. As a cross-check, nominal GDP grew 6.3% in Q2 2026.
(Strictly speaking, nominal GDP equals real GDP plus the GDP deflator, not core PCE. We use core PCE as a proxy for inflation, since it is the Fed’s inflation target.)
And for the first time in years, most of the yield curve (blue) is in this expected nominal GDP range (shaded). This is why we’re turning bullish on bonds for the first time in six years and moving to a long-duration position.
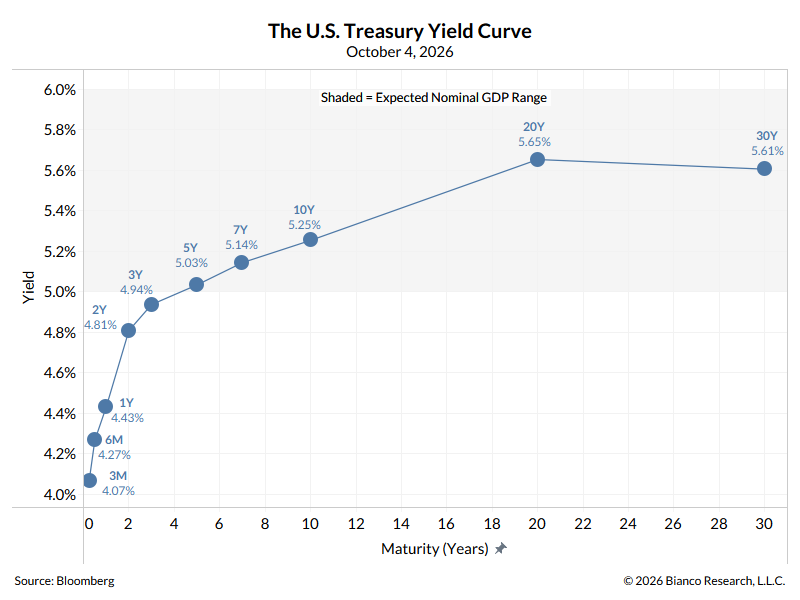
The bond market is no longer expensive, as it properly reflects the economy’s growth rate. We did not say it is “cheap.” That would happen only if yields move above nominal GDP, either because yields rise and/or nominal GDP falls (recession?).
Bond Math
In addition to yields moving into the range of nominal GDP, the bond math has finally turned positive for bond investors.
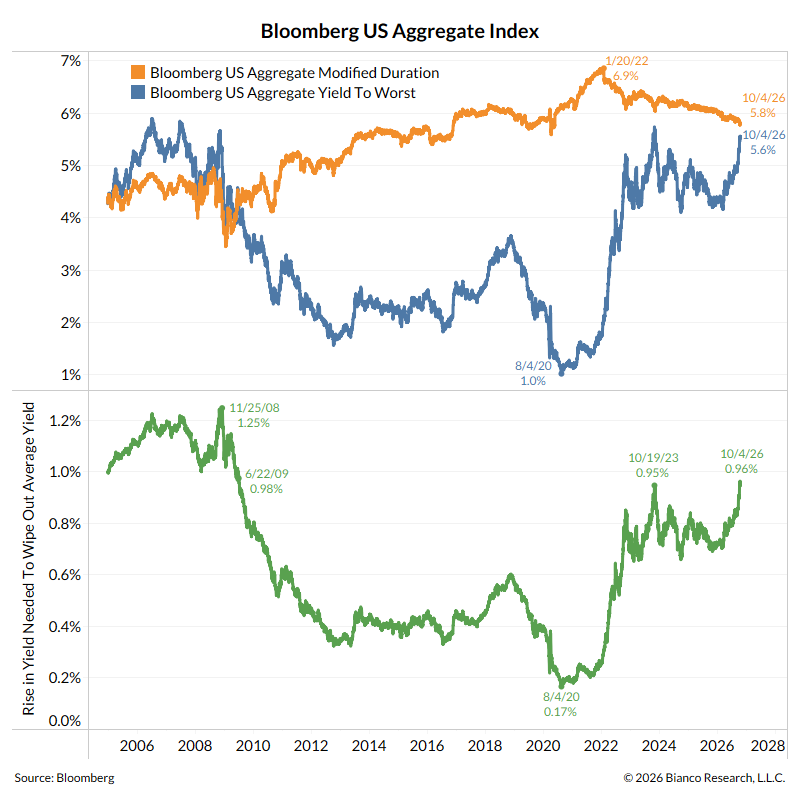
Modified duration (orange) shows how much a bond’s price will move (up or down) given a 1% move in yields. Note that this assumes an instantaneous move. Duration also changes over time. It changes with yield levels. This is known as convexity.
Yield to worst (blue) is the average yield assuming that all callable bonds are called at the most inconvenient time for investors.
Divide these two measures to see how much of a move in yields over the next year is required to offset or wipe out the average yield (green). At 0.96%, it is the highest since June 2009. This means the average yield of the Bloomberg aggregate index, now 5.6%, could rise to about 6.5% over the next year and the index would still have a positive return.
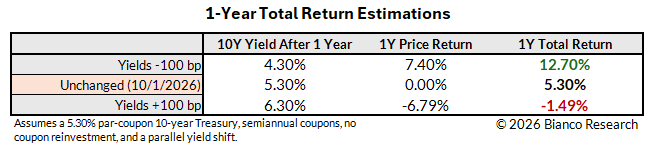
The table below shows how the current asymmetric bond returns favor investors, using a 10-year Treasury.
If yields fall 100 bps (1%) over the next year, a 10-year Treasury will return 12.7%. If yields are unchanged over the next year, it will return 5.3%.
But if yields rise by 100 bp (1%) to 6.3%, the 10-year Treasury would only lose 1.49%.
This is the best bond math investors have seen since 2009.
Conclusion
President Trump is right that growth does not cause inflation. But growth still sets the price of money. A nominal economy growing 5% to 6% should have nominal yields of 5% to 6%. A 15% to 20% GDP growth economy would not get the lowest interest rates in the world. It would get the highest. If 20% growth were accompanied by 2% interest rates, that cheap money would spark a speculative frenzy that would distort the economy, create malinvestment, and eventually trigger massive inflation.
For years, yields were below where the economy said they should be. That is no longer the case. Most of the yield curve now sits inside the expected range for nominal GDP, and the Bloomberg Aggregate can absorb a nearly 1% rise in yields over the next year before its return turns negative. That cushion is the largest since 2009.
This is why we moved to 105% of our benchmark duration, our first long-duration position in six years. To be clear, this is a value call, not a call for lower yields. Inflation forecasts are still rising, and a 5% world means yields have little reason to fall far without a recession.
If yields move higher from here, bonds go from fairly valued to cheap. We would add to our overweight in that scenario.