Review: Two Years In
Since August 2023, we have been managing the Bianco Research Total Return Index (Bloomberg: BTRINDX). We manage this index at our discretion to outperform the typical fixed-income benchmark. In December 2023, our partners at WisdomTree started an ETF that tracks our index (Symbol: WTBN).
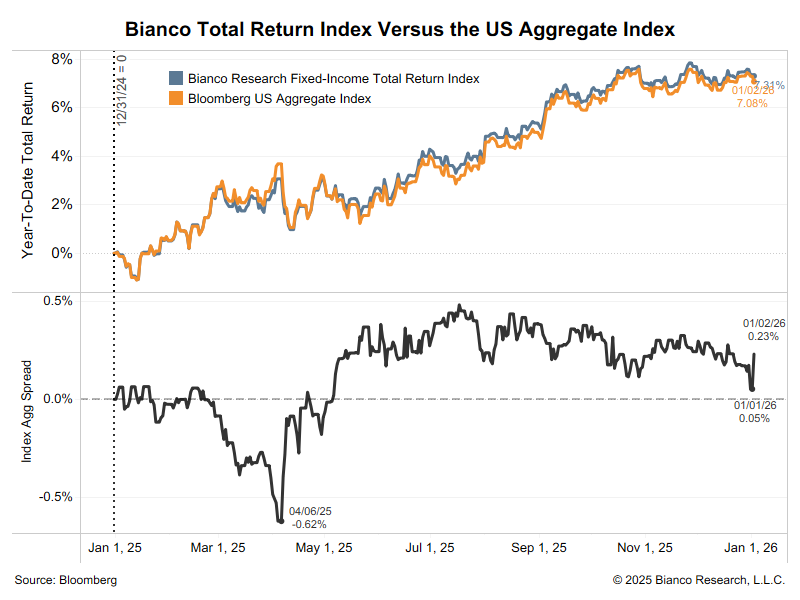
In 2025, our index marginally outperformed the Bloomberg U.S. Aggregate Index.
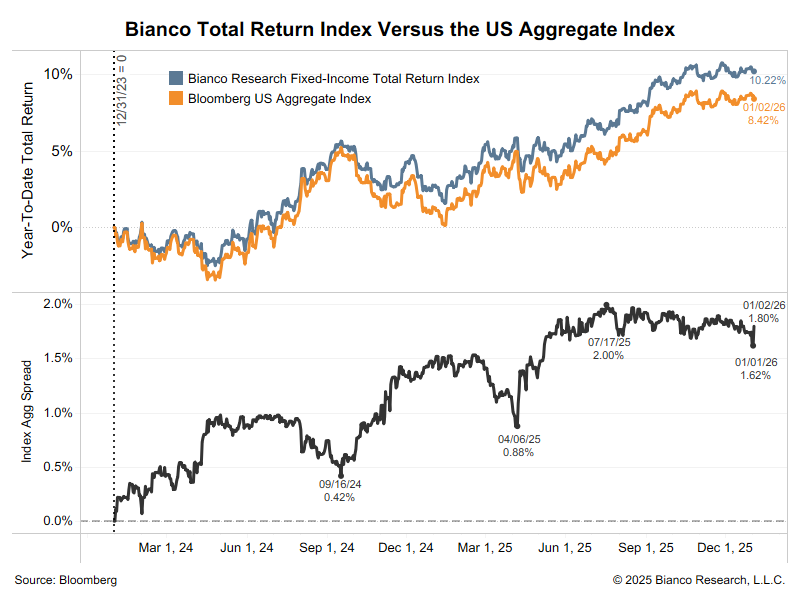
Effectively, our index has maintained the gains from 2024 and has significantly outperformed since December 2023.
Note that in our mid-year letter, we detailed how active management works in fixed-income (as opposed to equities).
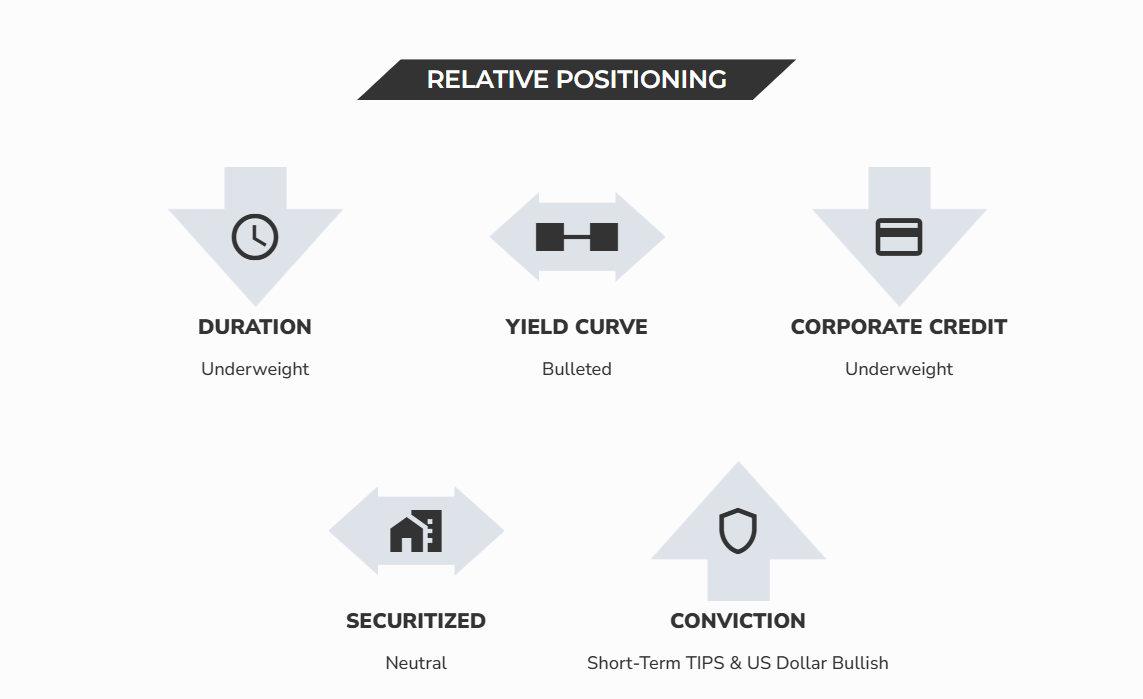
Additionally, our current positioning was detailed in our January 2026 Positioning Update. The highlights are below.
Outlook: The U.S. 10-Year Yield Stands Alone
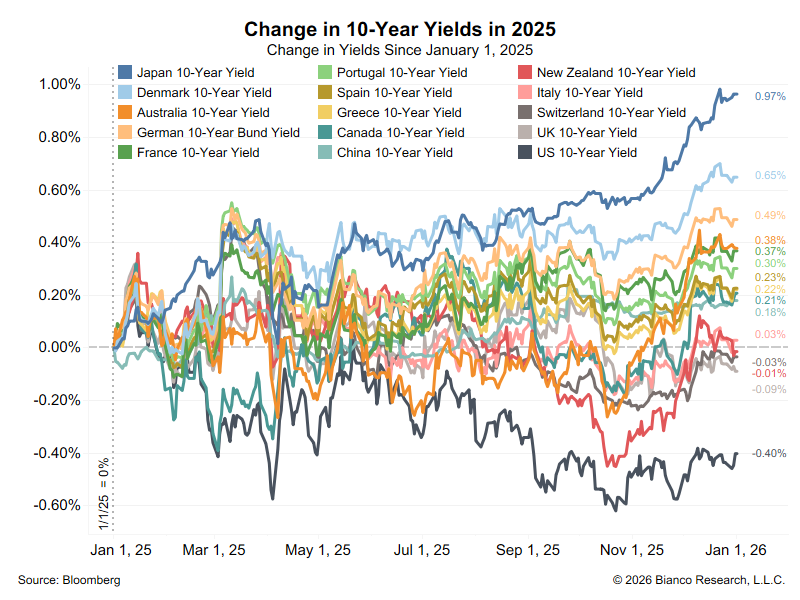
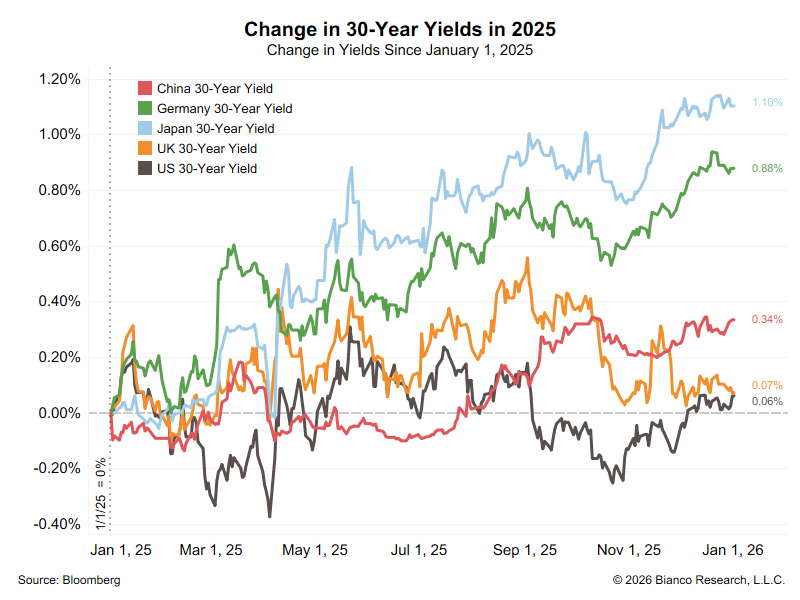
The chart below shows the change in 10-year yields in 2025 for the 15 largest bond markets.
- Japan (top blue) leads the way with a 97 bps rise in 2025
- 10 of the 15 countries’ 10-year yields rose in 2025
- Effectively, four of them were unchanged
Italy (pink) up 3 bps
New Zealand (red) down 1 bps
Switzerland (dark gray) down 3 bps
The UK (light gray) is down 9 bps
U.S. 10-year yields (black) were the anomaly, down 40 bps.
Not every country issues a 30-year bond. Those that do saw higher or unchanged yields on the year, including the U.S. (black).
Why was the U.S. 10-year yield the only long-term yield to fall in 2025?
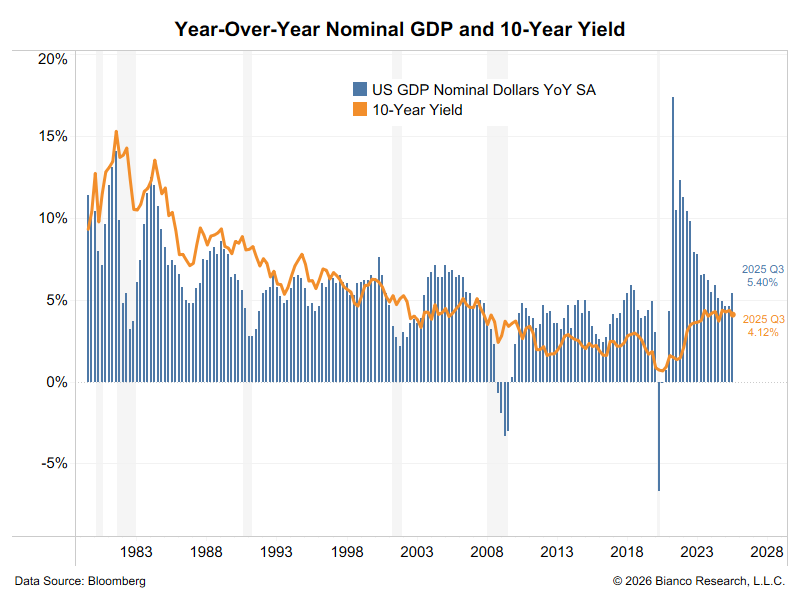
We can rule out the idea that the U.S. has weak economic growth. The most comprehensive overall measure of the economy is nominal GDP. This includes both real economic growth (real GDP) and inflation (Personal Consumption Expenditure). It is shown in the blue bars below.
Historically, long-term yields (orange line) have tracked nominal GDP. In the third quarter of 2025, nominal GDP ticked higher to a 5.40% year-over-year growth rate. This suggests the economy is too strong for long-term yields to fall meaningfully.
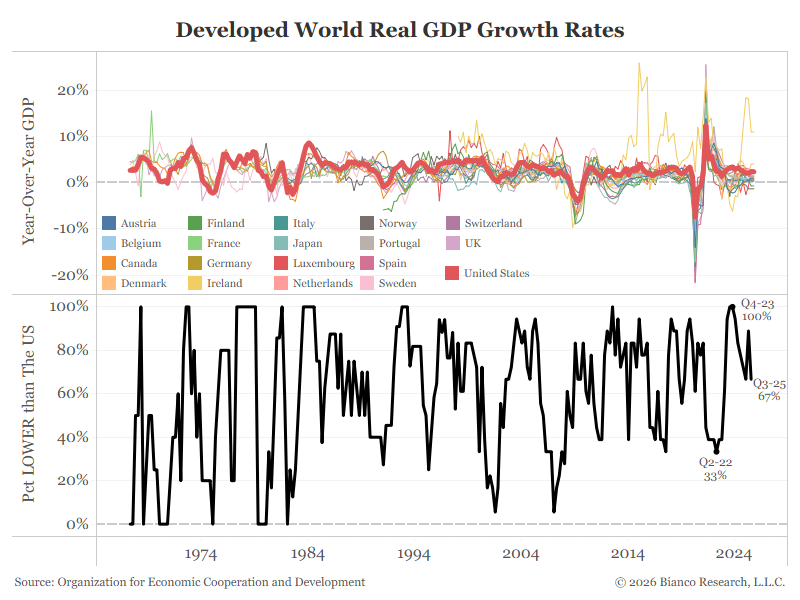
The Organization for Economic Cooperation and Development (OECD) harmonizes economic data across countries. The chart below shows real GDP growth for the 18 most developed countries, with the colored lines in the top panel. The thick red line shows U.S. real GDP.
The bottom panel shows that as of Q3 2025 (latest data) the U.S. had higher real GDP growth than 67% of the countries listed. Note that as recently as Q4 2024, the U.S. had the highest real GDP among these developed countries. The U.S. does not have weak growth relative to the rest of the world.
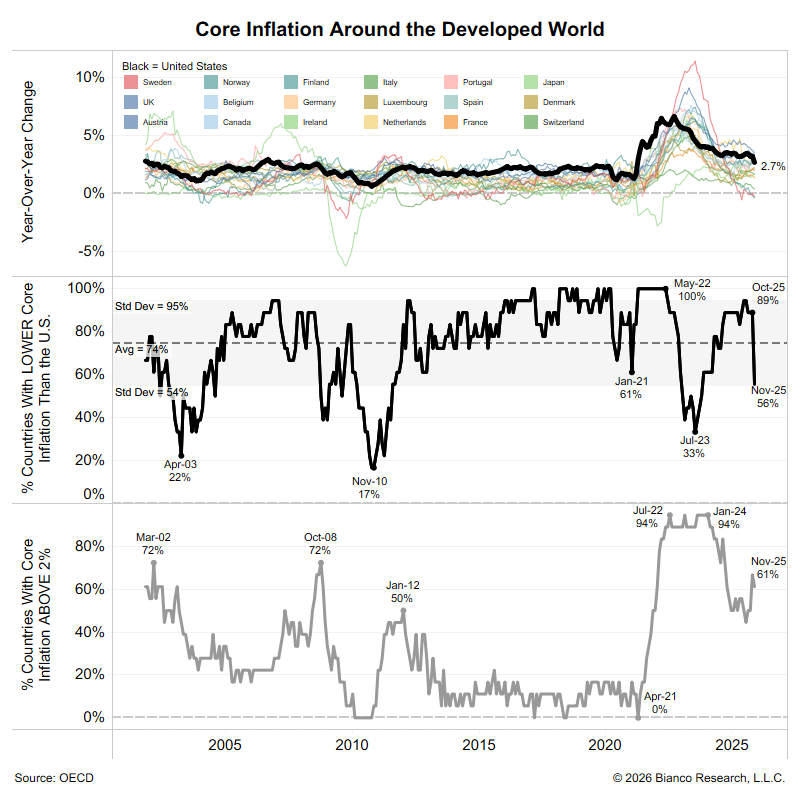
We can also rule out the idea that the U.S. has abnormally low inflation. The following chart is similar to the one above but measures core inflation for the same developed countries.
The middle panel shows that the U.S. has higher core inflation than 56% of the countries shown. Note this was 89% in October. The decline could be attributed to the U.S. government shutdown, which led to no October data, and to the government statistical mills assuming zero. In other words, the recent drop is based on questionable assumptions.
The bottom panel shows the percentage of these countries that have inflation below 2%, the typical central bank target for most countries. 61% are above this target, including the United States. Also note that this measure was typically near 0% from 2010 to 2020 (post-financial-crisis recovery) and rarely exceeded 50% since 2001 (post-9/11 recovery). For almost four years, a majority of the developed world has continued to experience inflation above 2%.
The following chart isolates headline CPI in the United States. It is color-coded to distinguish inflation in the post-COVID recovery (blue), the post-financial crisis recovery (red), and the post-9/11 recovery (green). The current headline inflation rate of 2.7% is still higher than in most periods of the previous recovery (red) and above the average inflation rate during the previous recovery (green).
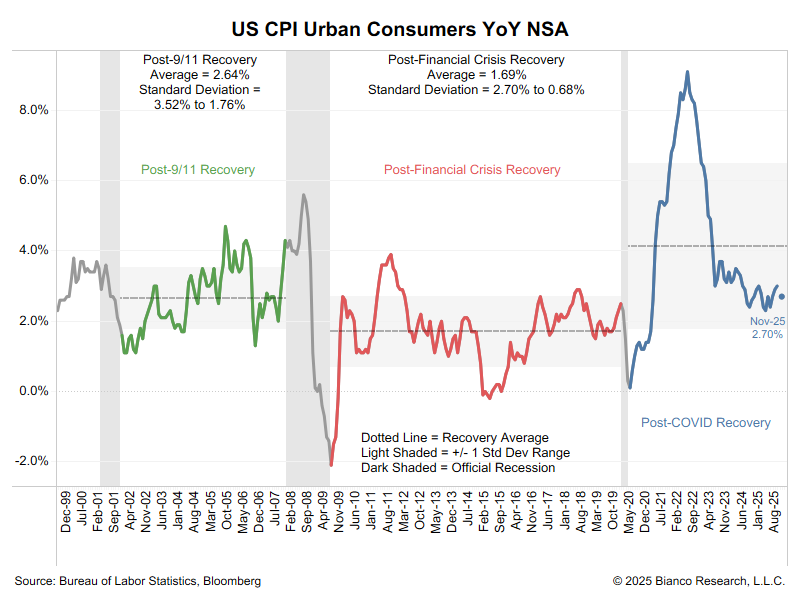
In sum, nothing suggests the U.S. has inflation under control or that it will return to 2%. Its inflation rate is not an outlier versus other developed countries, yet the U.S. 10-year yield stands alone in falling in 2025.
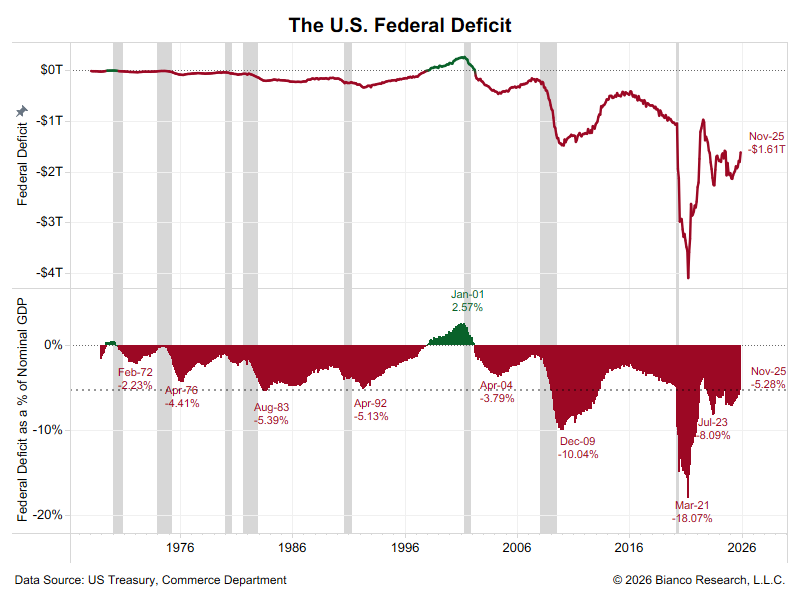
We can also rule out the idea that a lack of supply is driving U.S. yields lower. The U.S. does not have its budget deficit under control and has had to ramp up Treasury issuance.
The top panel below shows that the U.S. federal deficit was $1.61 trillion as of November (latest data). The bottom shows this as a percentage of GDP. The current deficit of 5.28% of GDP is larger than any of the recessions from the 1970s to 1990s.
Typically, the government runs a counter-cyclical policy. They spend in a recession to stimulate growth. Once the recession ends, spending will subside. However, the federal government is now spending as if the country is still in a recession.
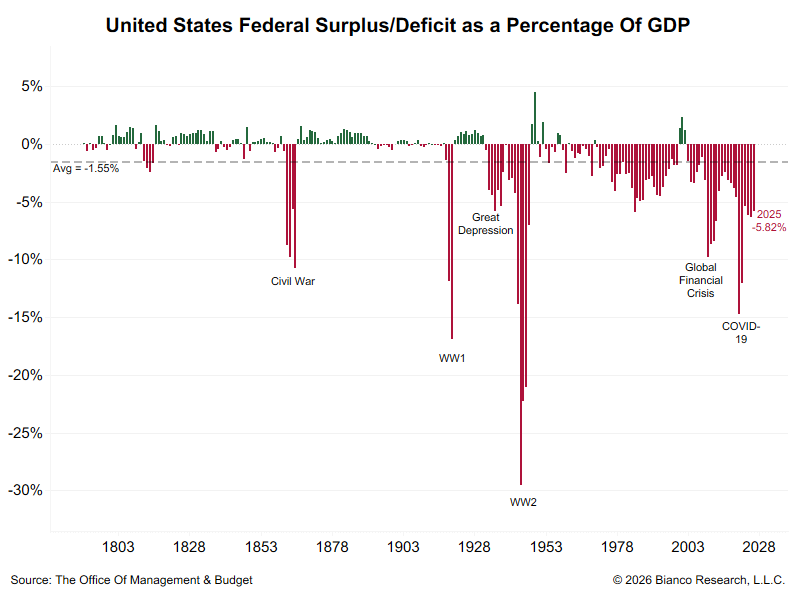
In fiscal 2025 (the U.S. fiscal year ends in September), the U.S. deficit was 5.82% of GDP, the lowest level since 2019. Note that the only other time the deficit was lower relative to GDP was during the Civil War, WW I, the Great Depression, WW II, the 2008 financial crisis, and COVID-19. In other words, this is the biggest non-war or crisis deficit in American history.
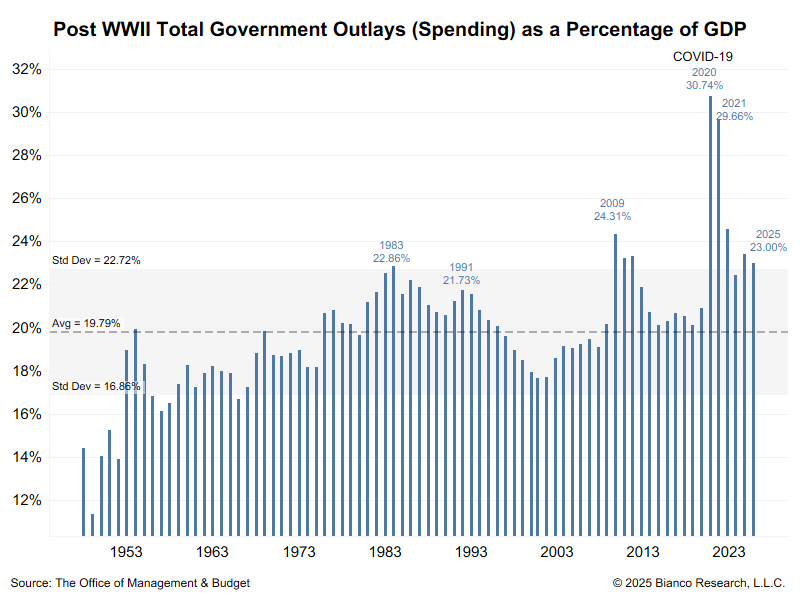
2025 finished with government spending accounting for 23% of GDP. Since the end of World War II, only 2009 (the financial crisis) and 2020/2021 (COVID) have seen government spending account for a larger share of GDP. Again, the government is spending as if the country were in a recession, even though it is not.
The U.S. has one feature unique to everyone else. Trump measures his success by the change in the 10-year yield. And the lower it goes, the better a job he thinks he is doing.
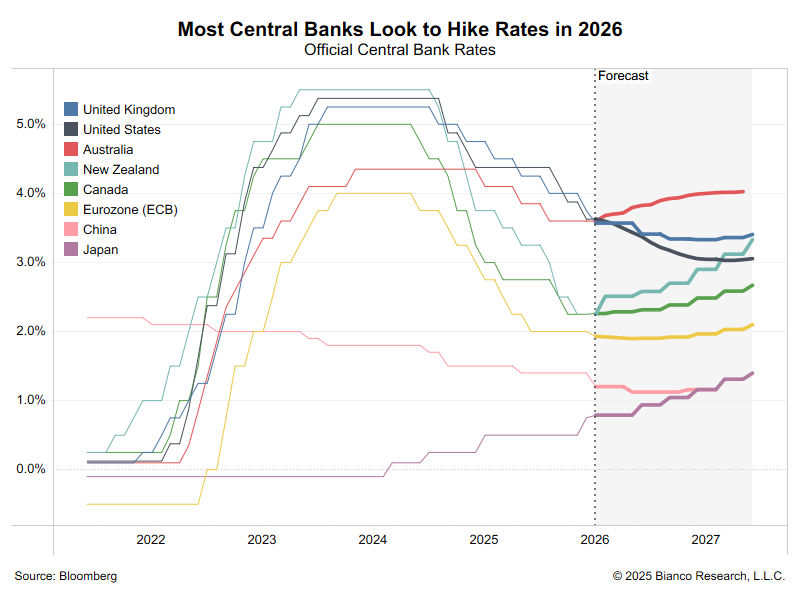
The chart below shows the central bank rate for eight markets with derivatives, which can be used to infer expectations about monetary policy in 2026. The thin line is the actual rate. The thick line within the shaded area represents the derivative-based expectations for 2026.
- Central banks of five of the eight countries are expected to hike rates in 2026 (Japan in purple, ECB in yellow, Canada in green, New Zealand in cyan, and Australia in red)
- China (pink) is priced to hold rates steady in 2026
- The UK (blue) is priced to cut 25 bps in 2026
- The US (black) is priced to cut 50 bps in 2026
Trump is the only leader obsessed with his central bank, perhaps because he believes lower short-term rates will lead to lower 10-year yields. He has insulted the central bank’s head, demanded aggressive rate cuts, and personally led the search to replace the Fed’s head. And the Fed is expected to cut rates more aggressively than any other major central bank, despite faster growth than most of the developed world, higher inflation than most of the developed world, and budget deficits and government spending at crisis levels.
Conclusion
Every developed-world bond market saw higher long-term yields, with one exception: the U.S. 10-year yield. The case that the 10-year should have been the outlier is hard to make, given the country’s strong growth, higher-than-average inflation, and large budget deficit. We believe the trends are in place for higher long-term yields in 2026.